

then and there
IDDV mfa thesis, NEU 2025-26
The Pacific Northwest is a region known for its distinct eerie, uncomfortable, yet cozy and familiar emotional quality, made visible through nostalgic media touchstones like Twin Peaks and The Twilight Saga and more recently as a major focus in nostalgia aesthetics and subcultures on the internet. While these depictions of the PNW capture its unique feeling, they don’t help us understand the complex emotional mechanics of the place-induced nostalgic response, particularly across different generations. How do different age groups experience nostalgia for a rural town in Washington, a coastal forest, or a coffee kiosk on I-5? How does nostalgia come up in everyday life, what constellations of emotions make up the experience, and how does that nostalgia shape or reflect identity tied to the PNW?
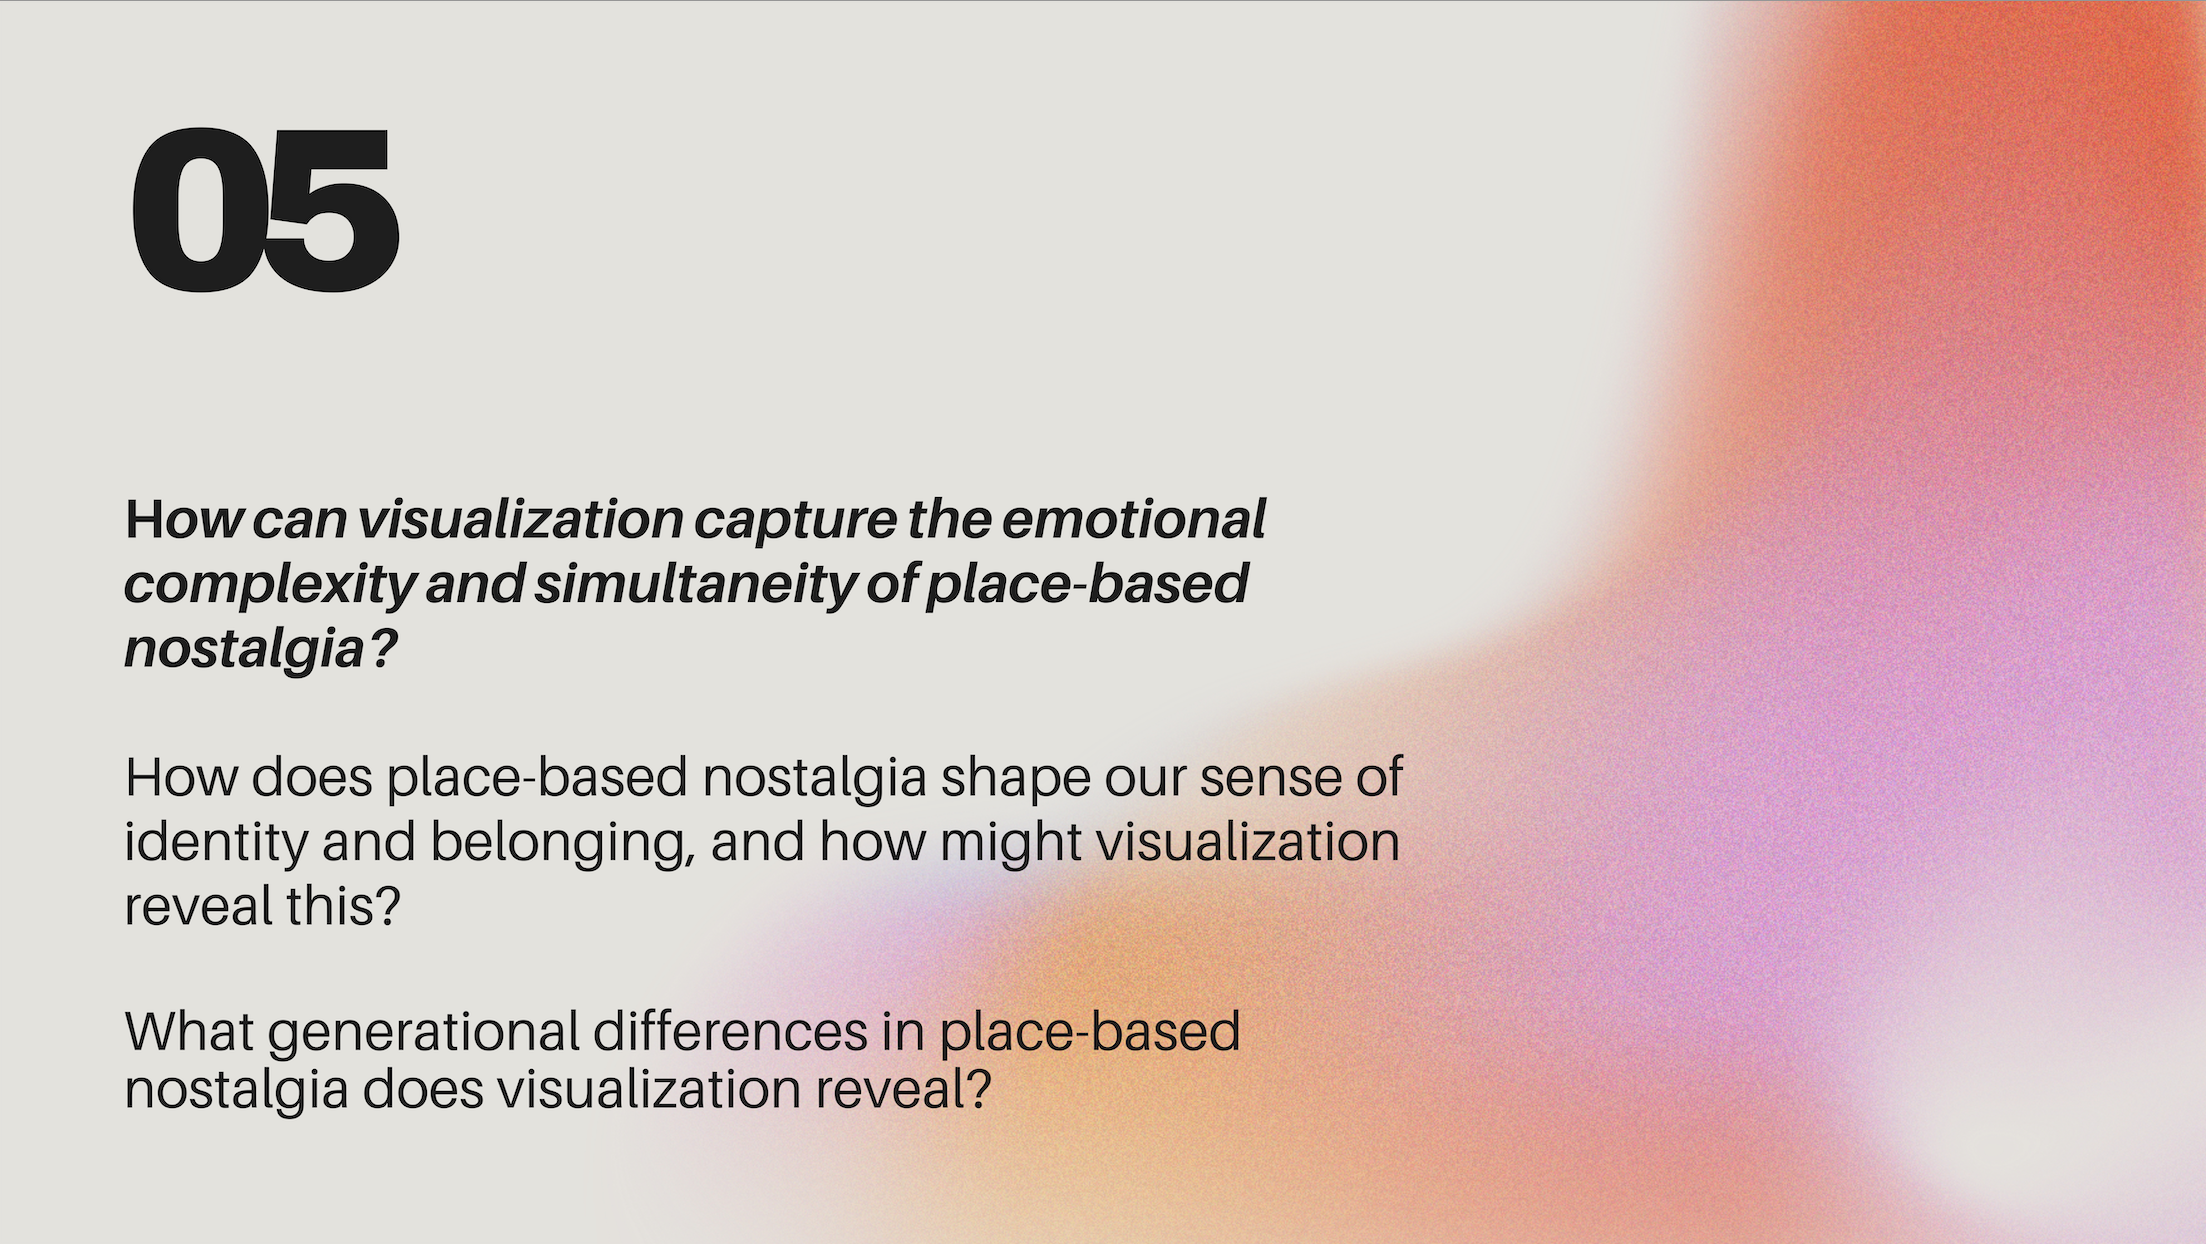
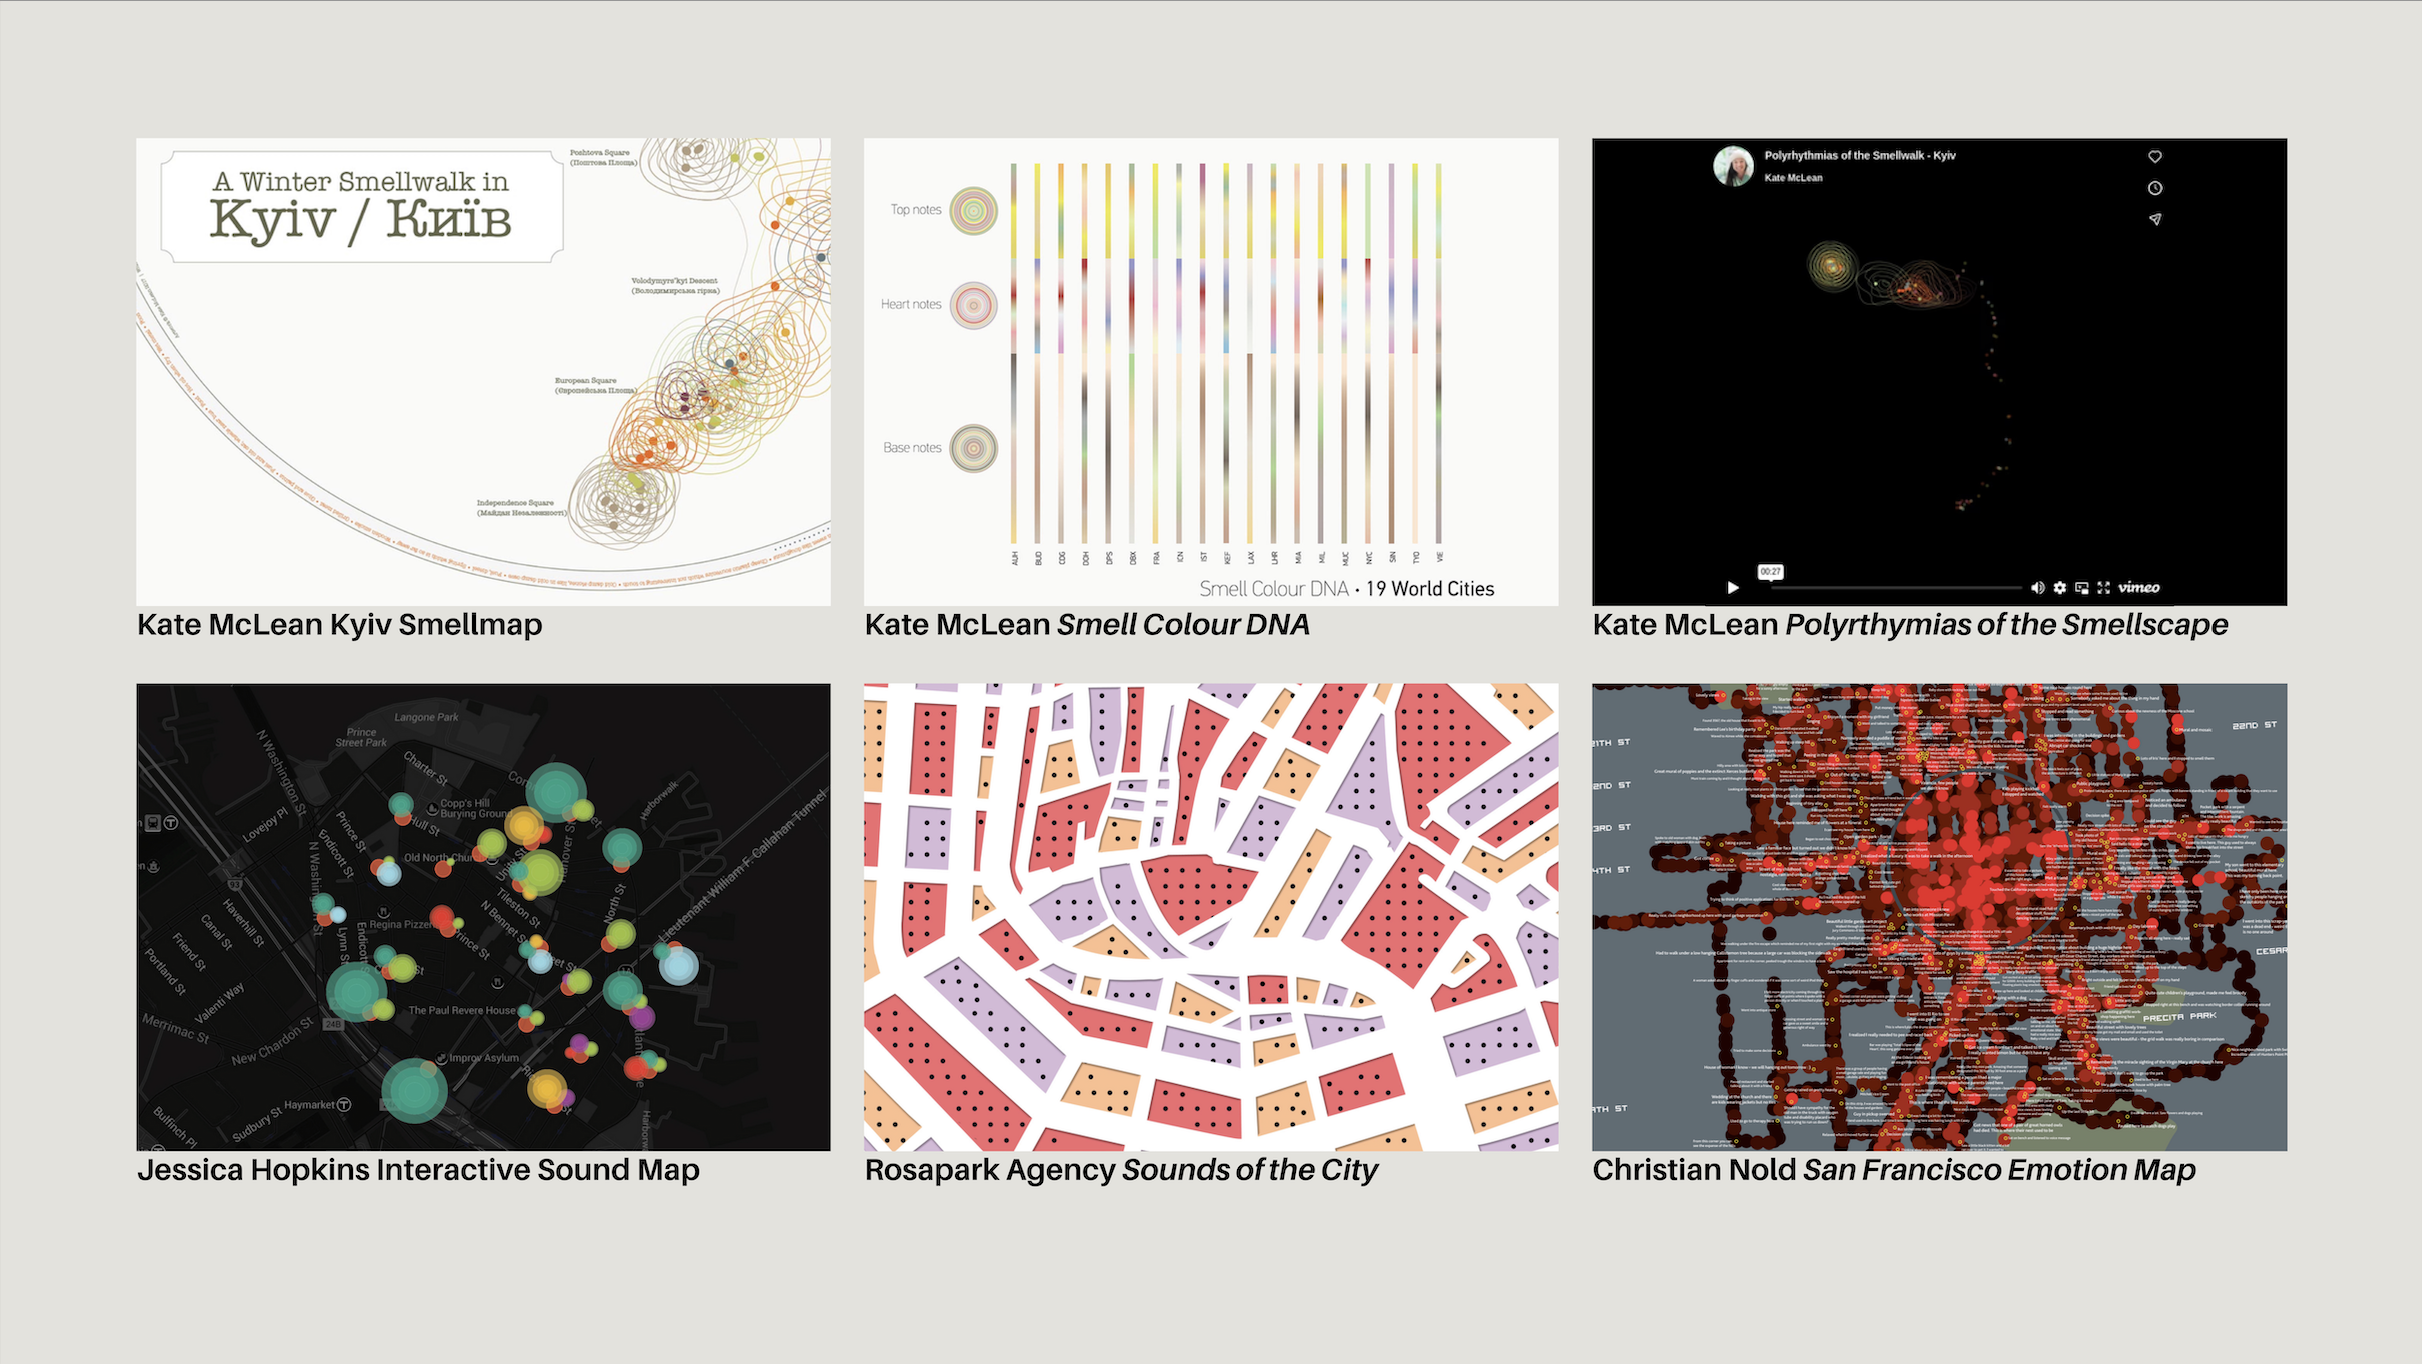
This project investigates how visualization might capture the emotional complexity and simultaneity of place-based nostalgia, how two different generations view and remember the same region, and how the connections between nostalgia, place, and identity might be illuminated. Referencing Göran Bolin’s framework of “media generations” and drawing on the sensory mapping and emotional cartography techniques of Kate McLean and Christian Nold, this project translates collected emotional and memory data from two generations of PNW residents into an immersive “emotional landscape” map. Rather than mapping based on true coordinates and geographic markers, this digital visualization uses information-driven color, texture, movement, and abstract form to chart the Pacific Northwest as it exists in nostalgic memory, serving as an archival piece of a special place that used to exist or never really existed at all.
1 Experimental stage [8.25-11.25]2 Proposal refinement [11.25-12.25]2 Research stage [12.25-2.26]3 Design stage [1.26-4.26]4 Synthesis [4.26-5.26]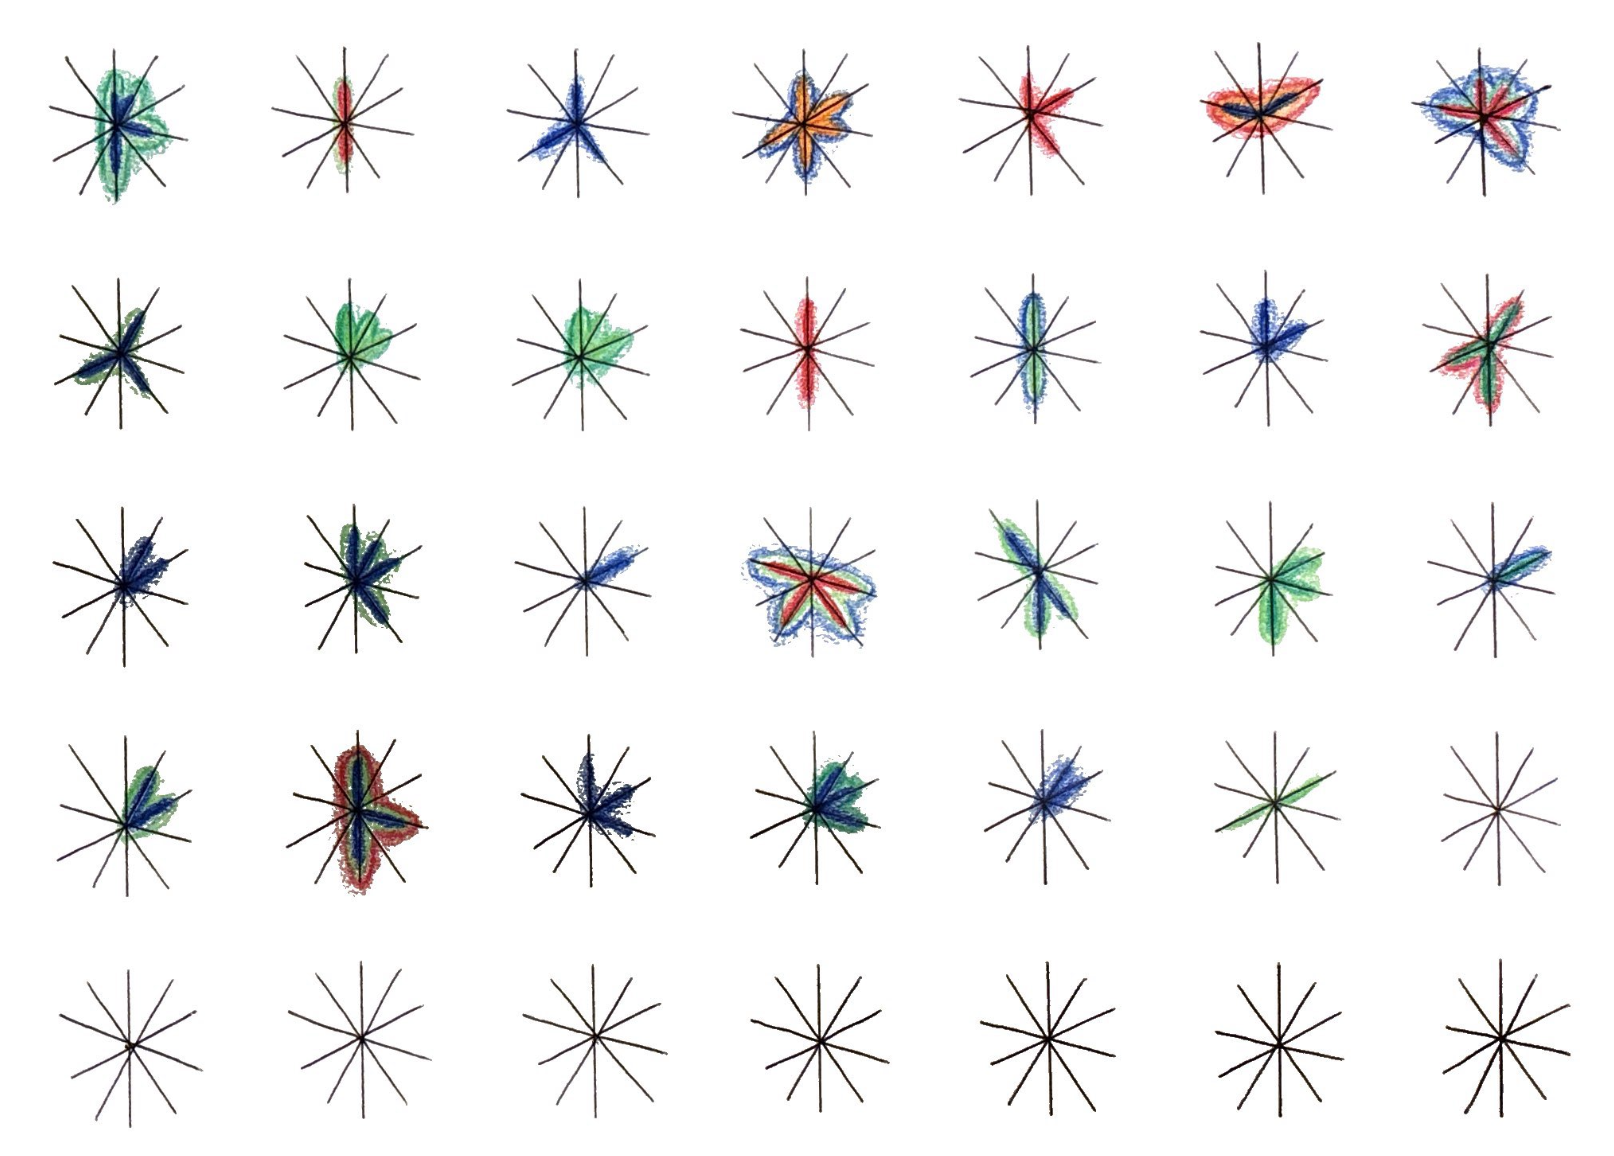
moments of nostalgia
![where and when [memory]](https://images.squarespace-cdn.com/content/v1/6525c4b42af6d222affc9ad1/b1305a71-a16c-4fe9-b1f4-7c0ef5f8c906/Nostalgia+Deliverable+1_Artboard+7-07.png)
where and when [memory]
![where and when [trigger]](https://images.squarespace-cdn.com/content/v1/6525c4b42af6d222affc9ad1/1232cb93-d7f9-4967-9ae5-bd5dba6afeaf/Nostalgia+Deliverable+1-06.png)
where and when [trigger]
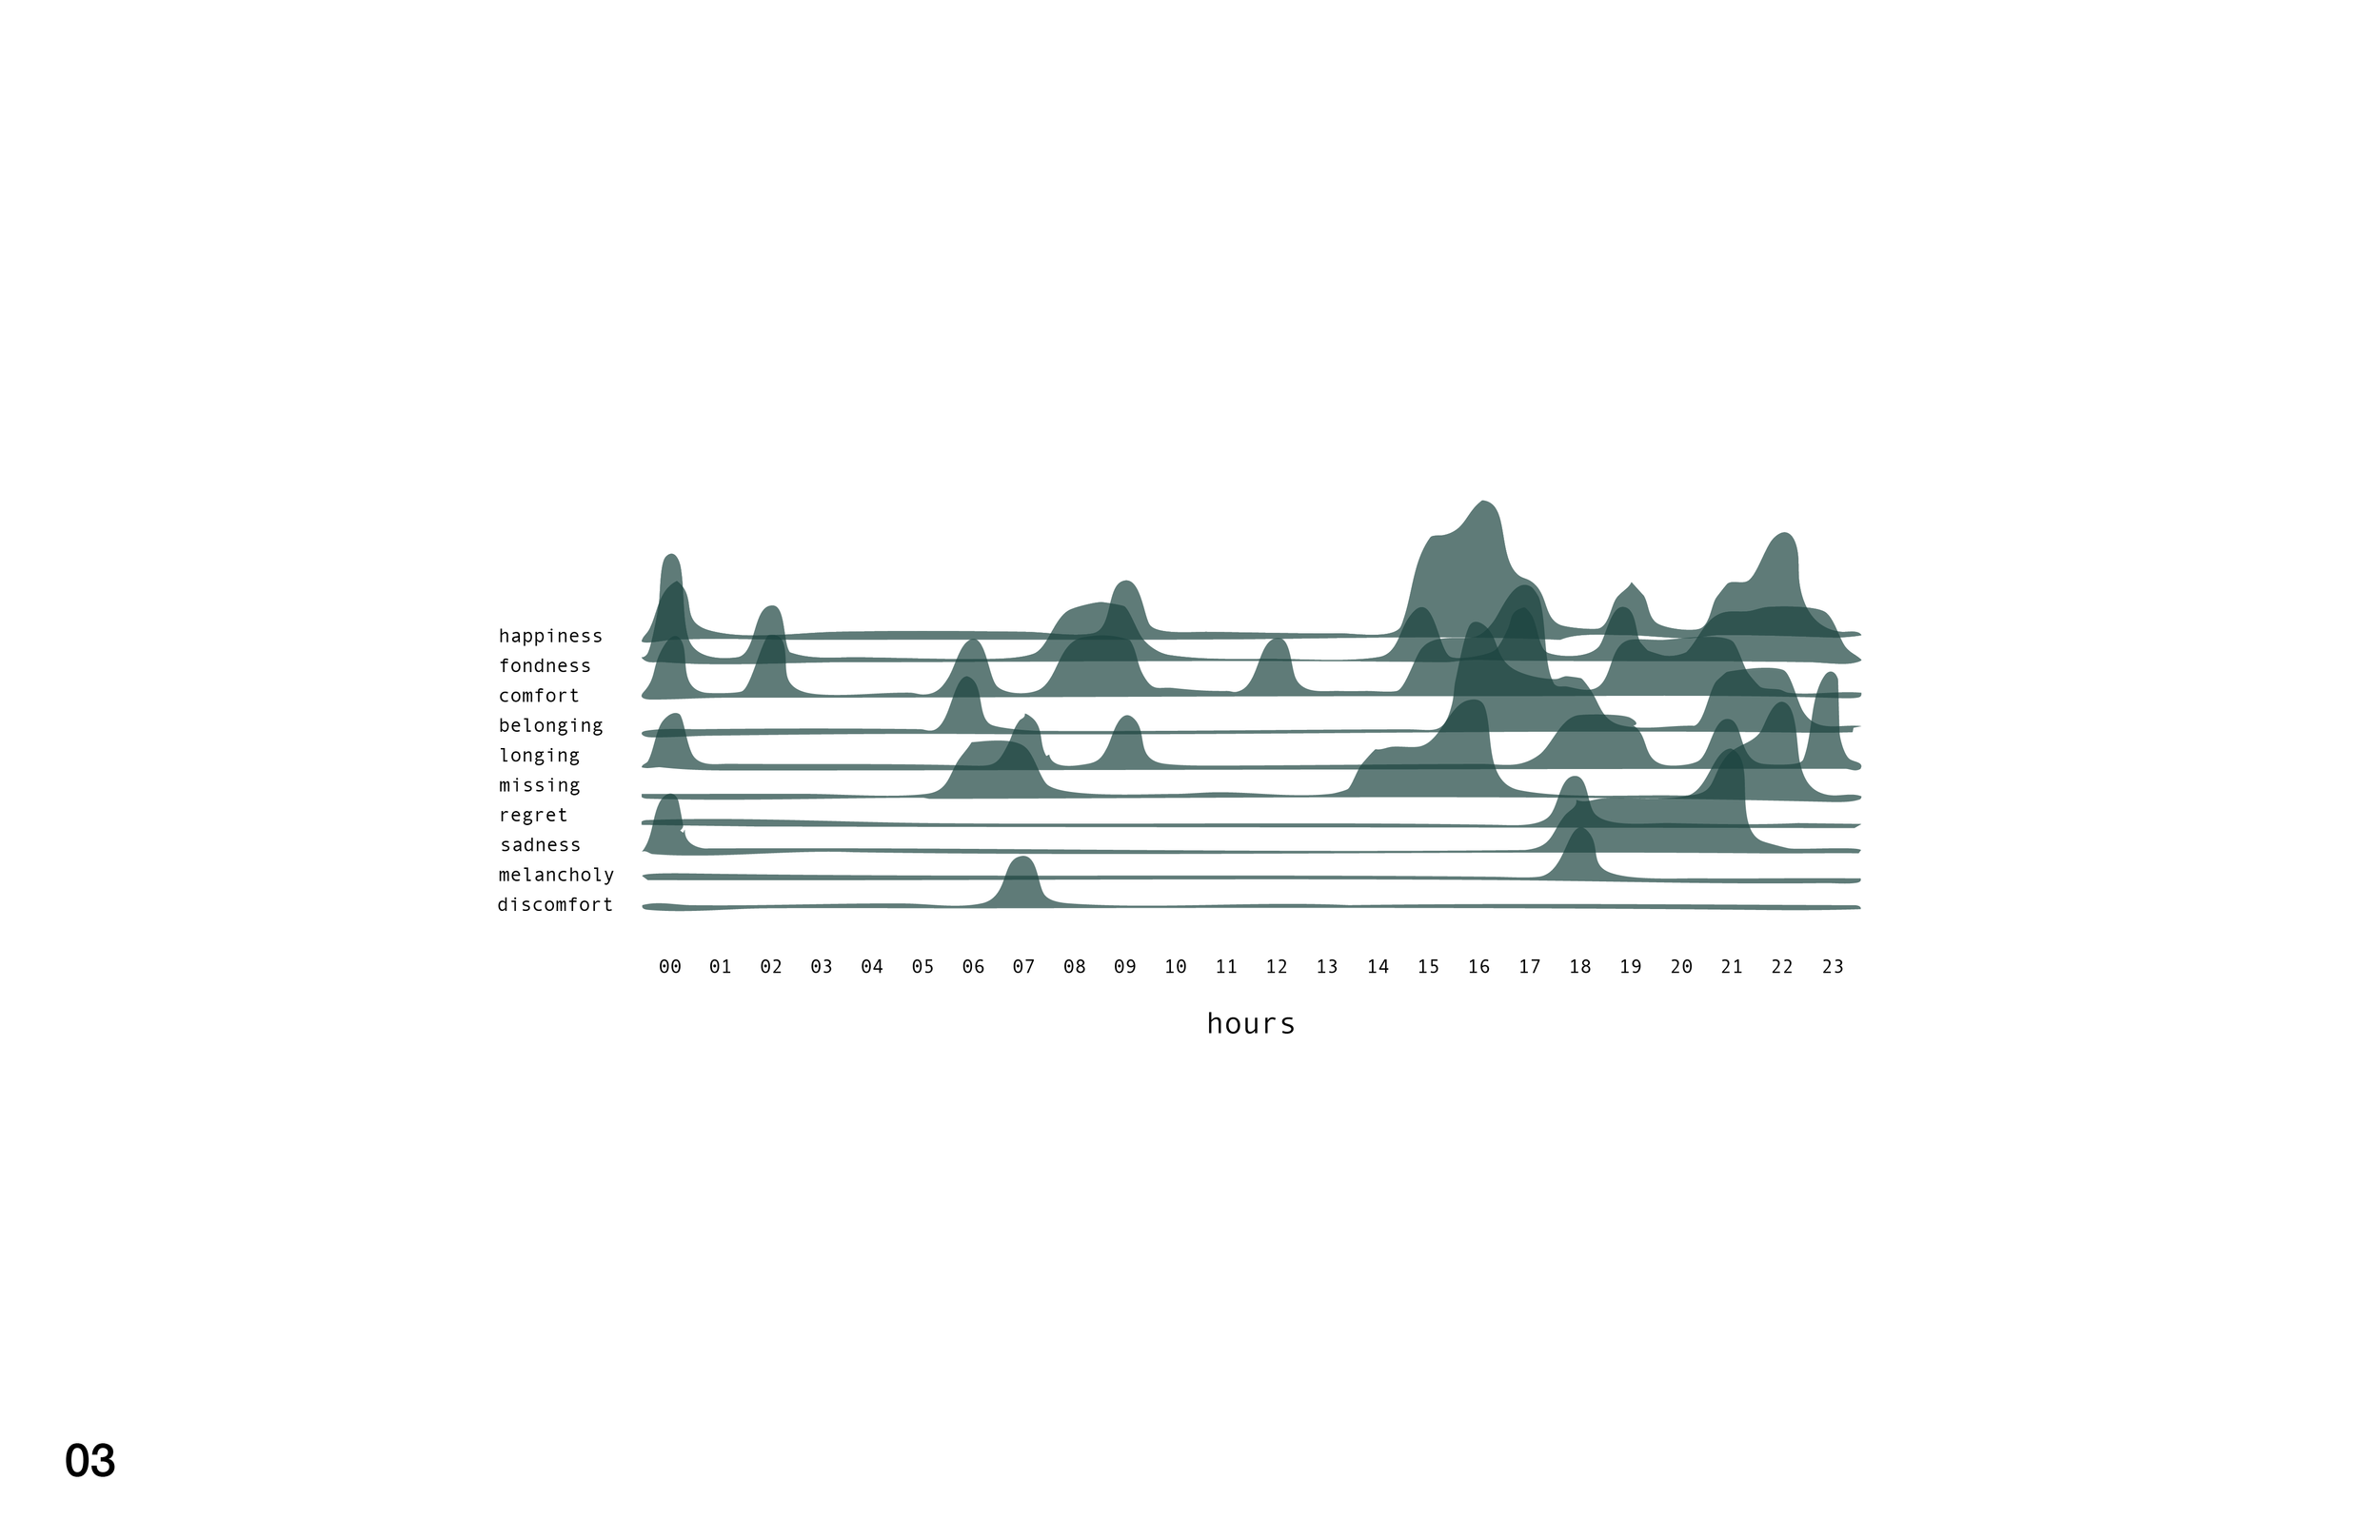
emotional hours
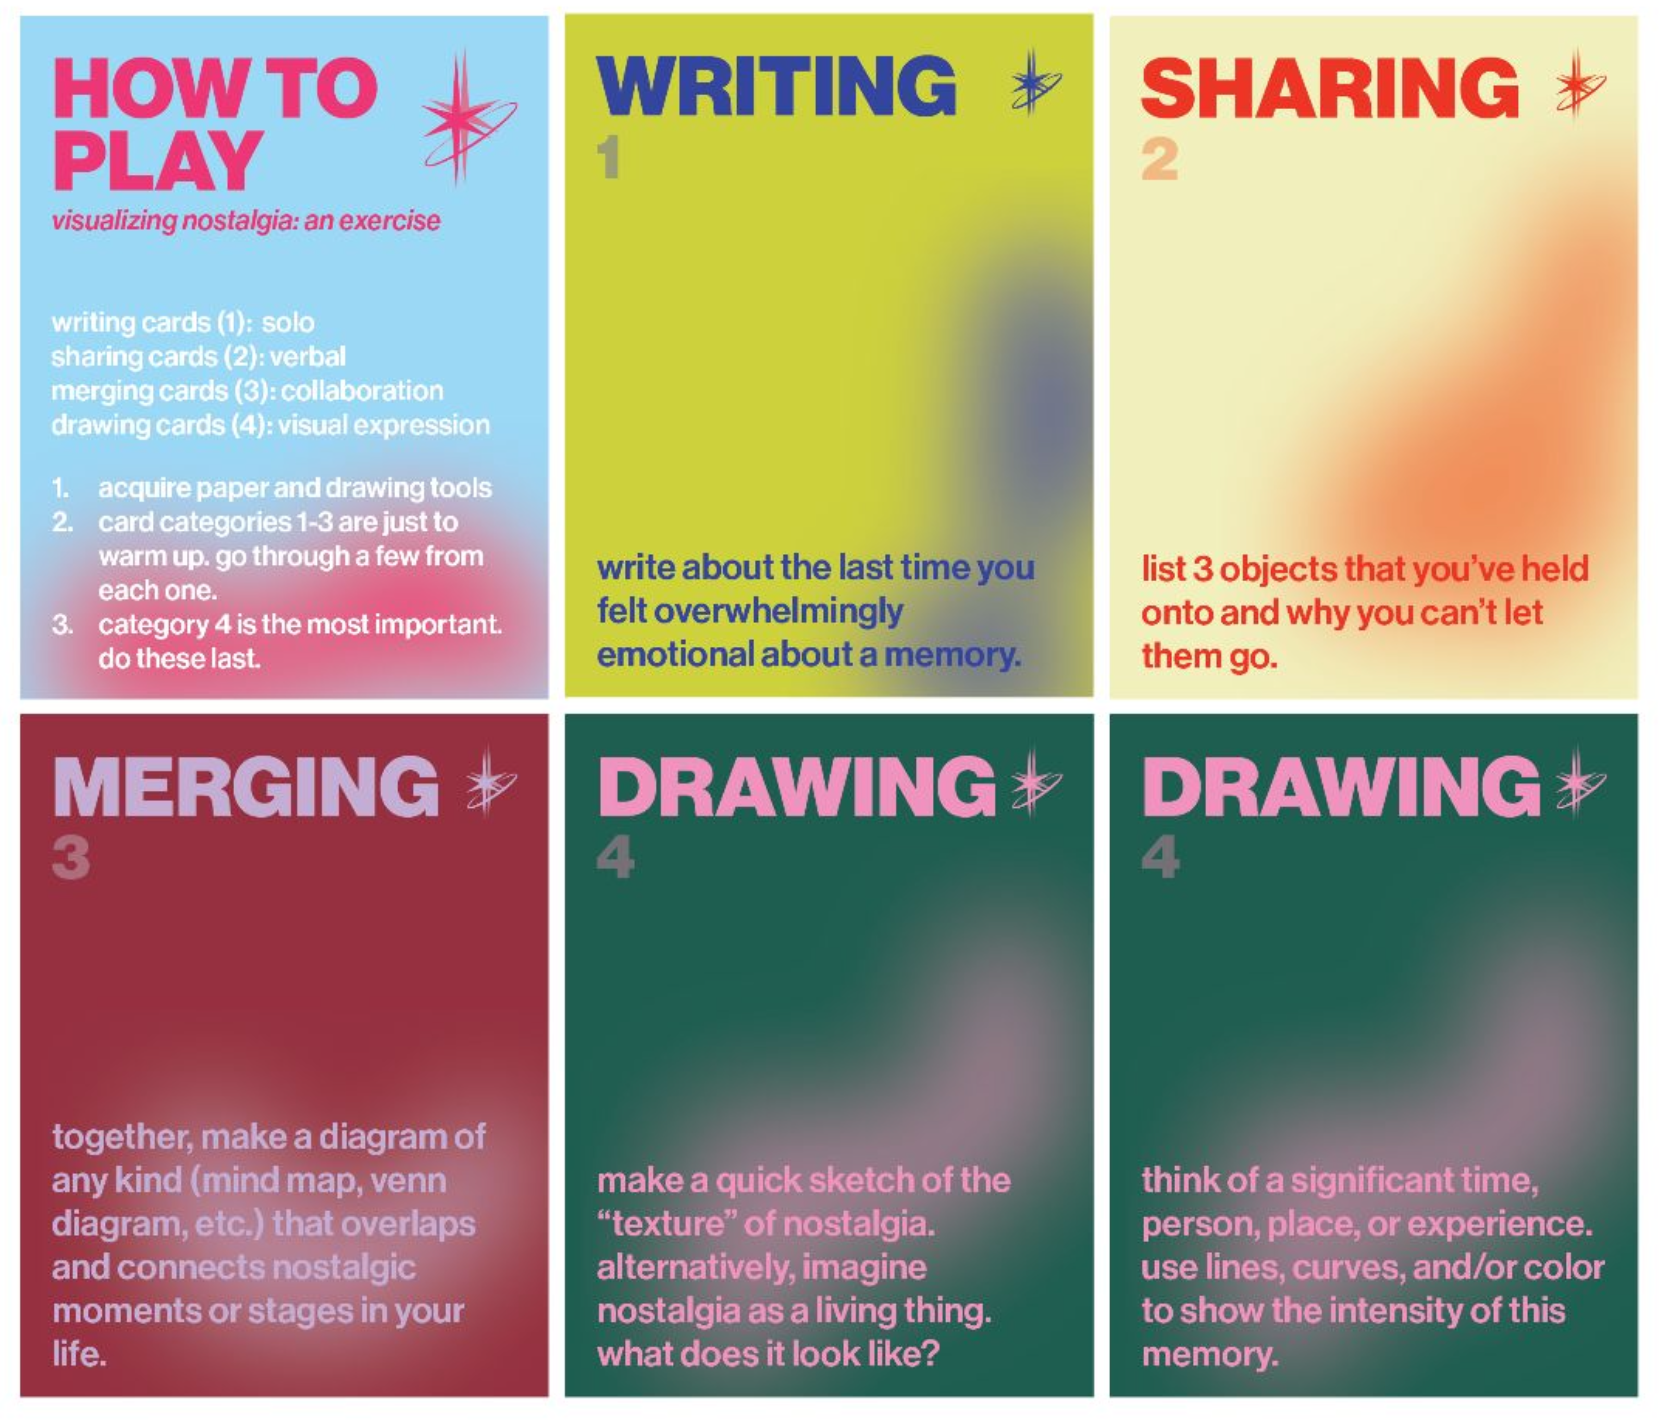
nostalgia game
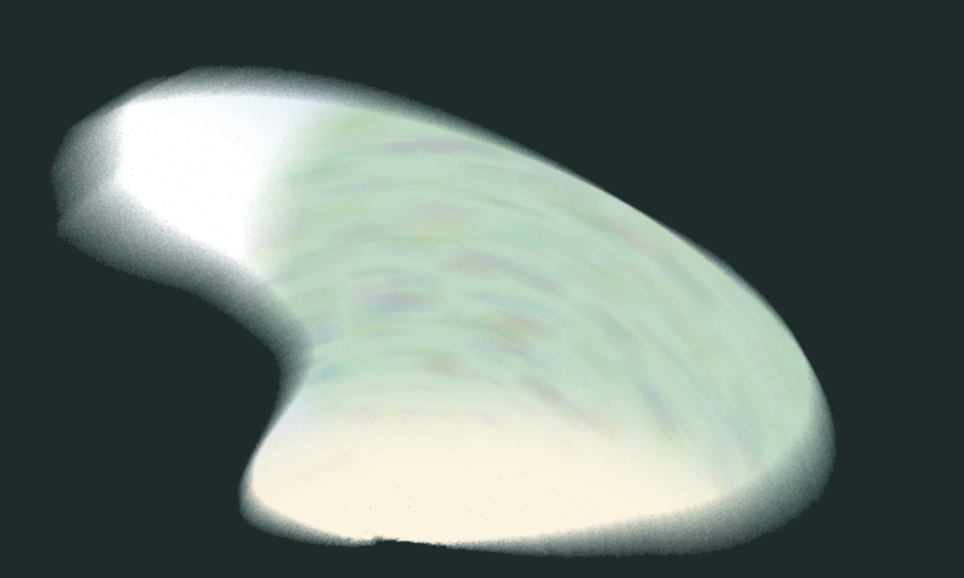
what "comfort" looks like
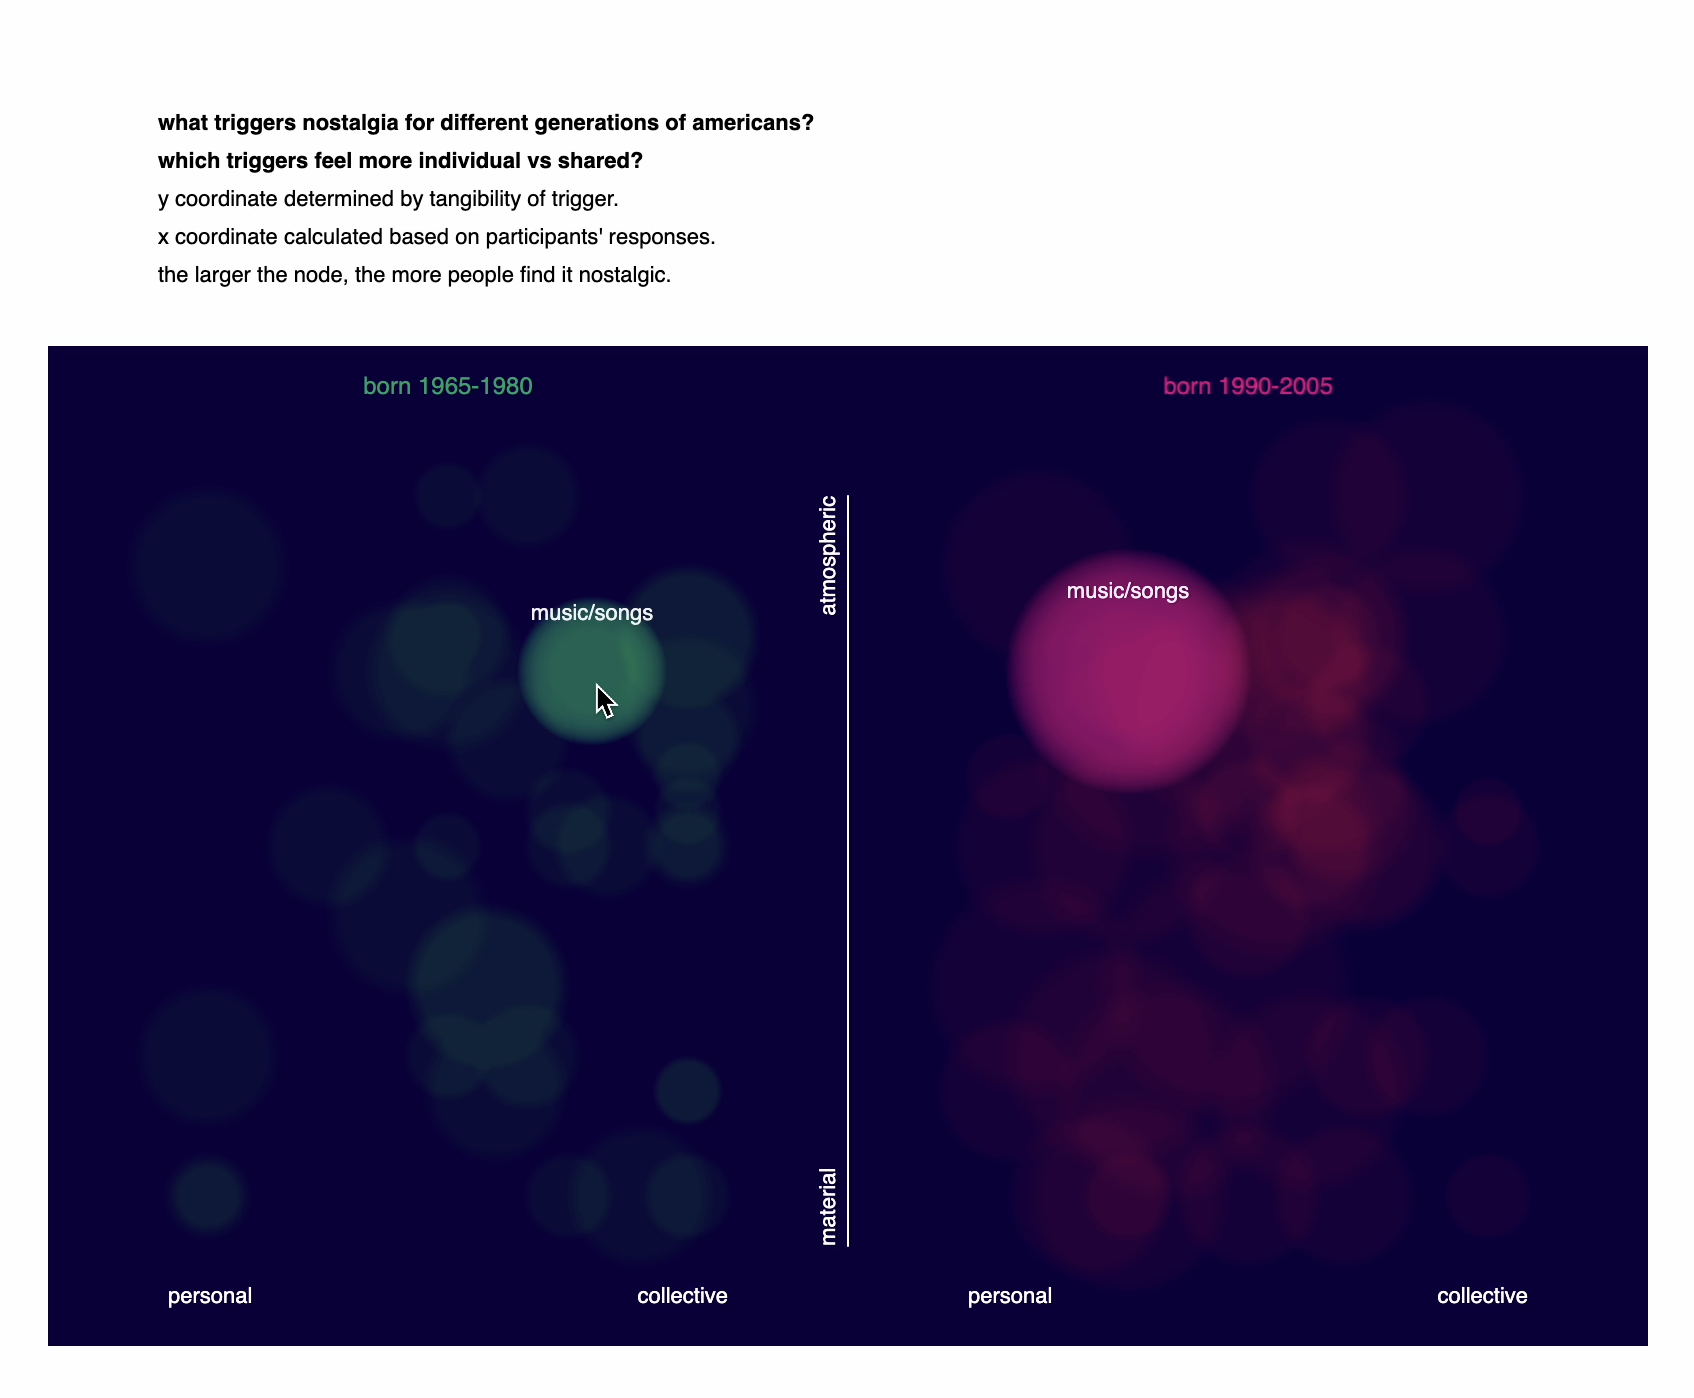
interactive trigger map
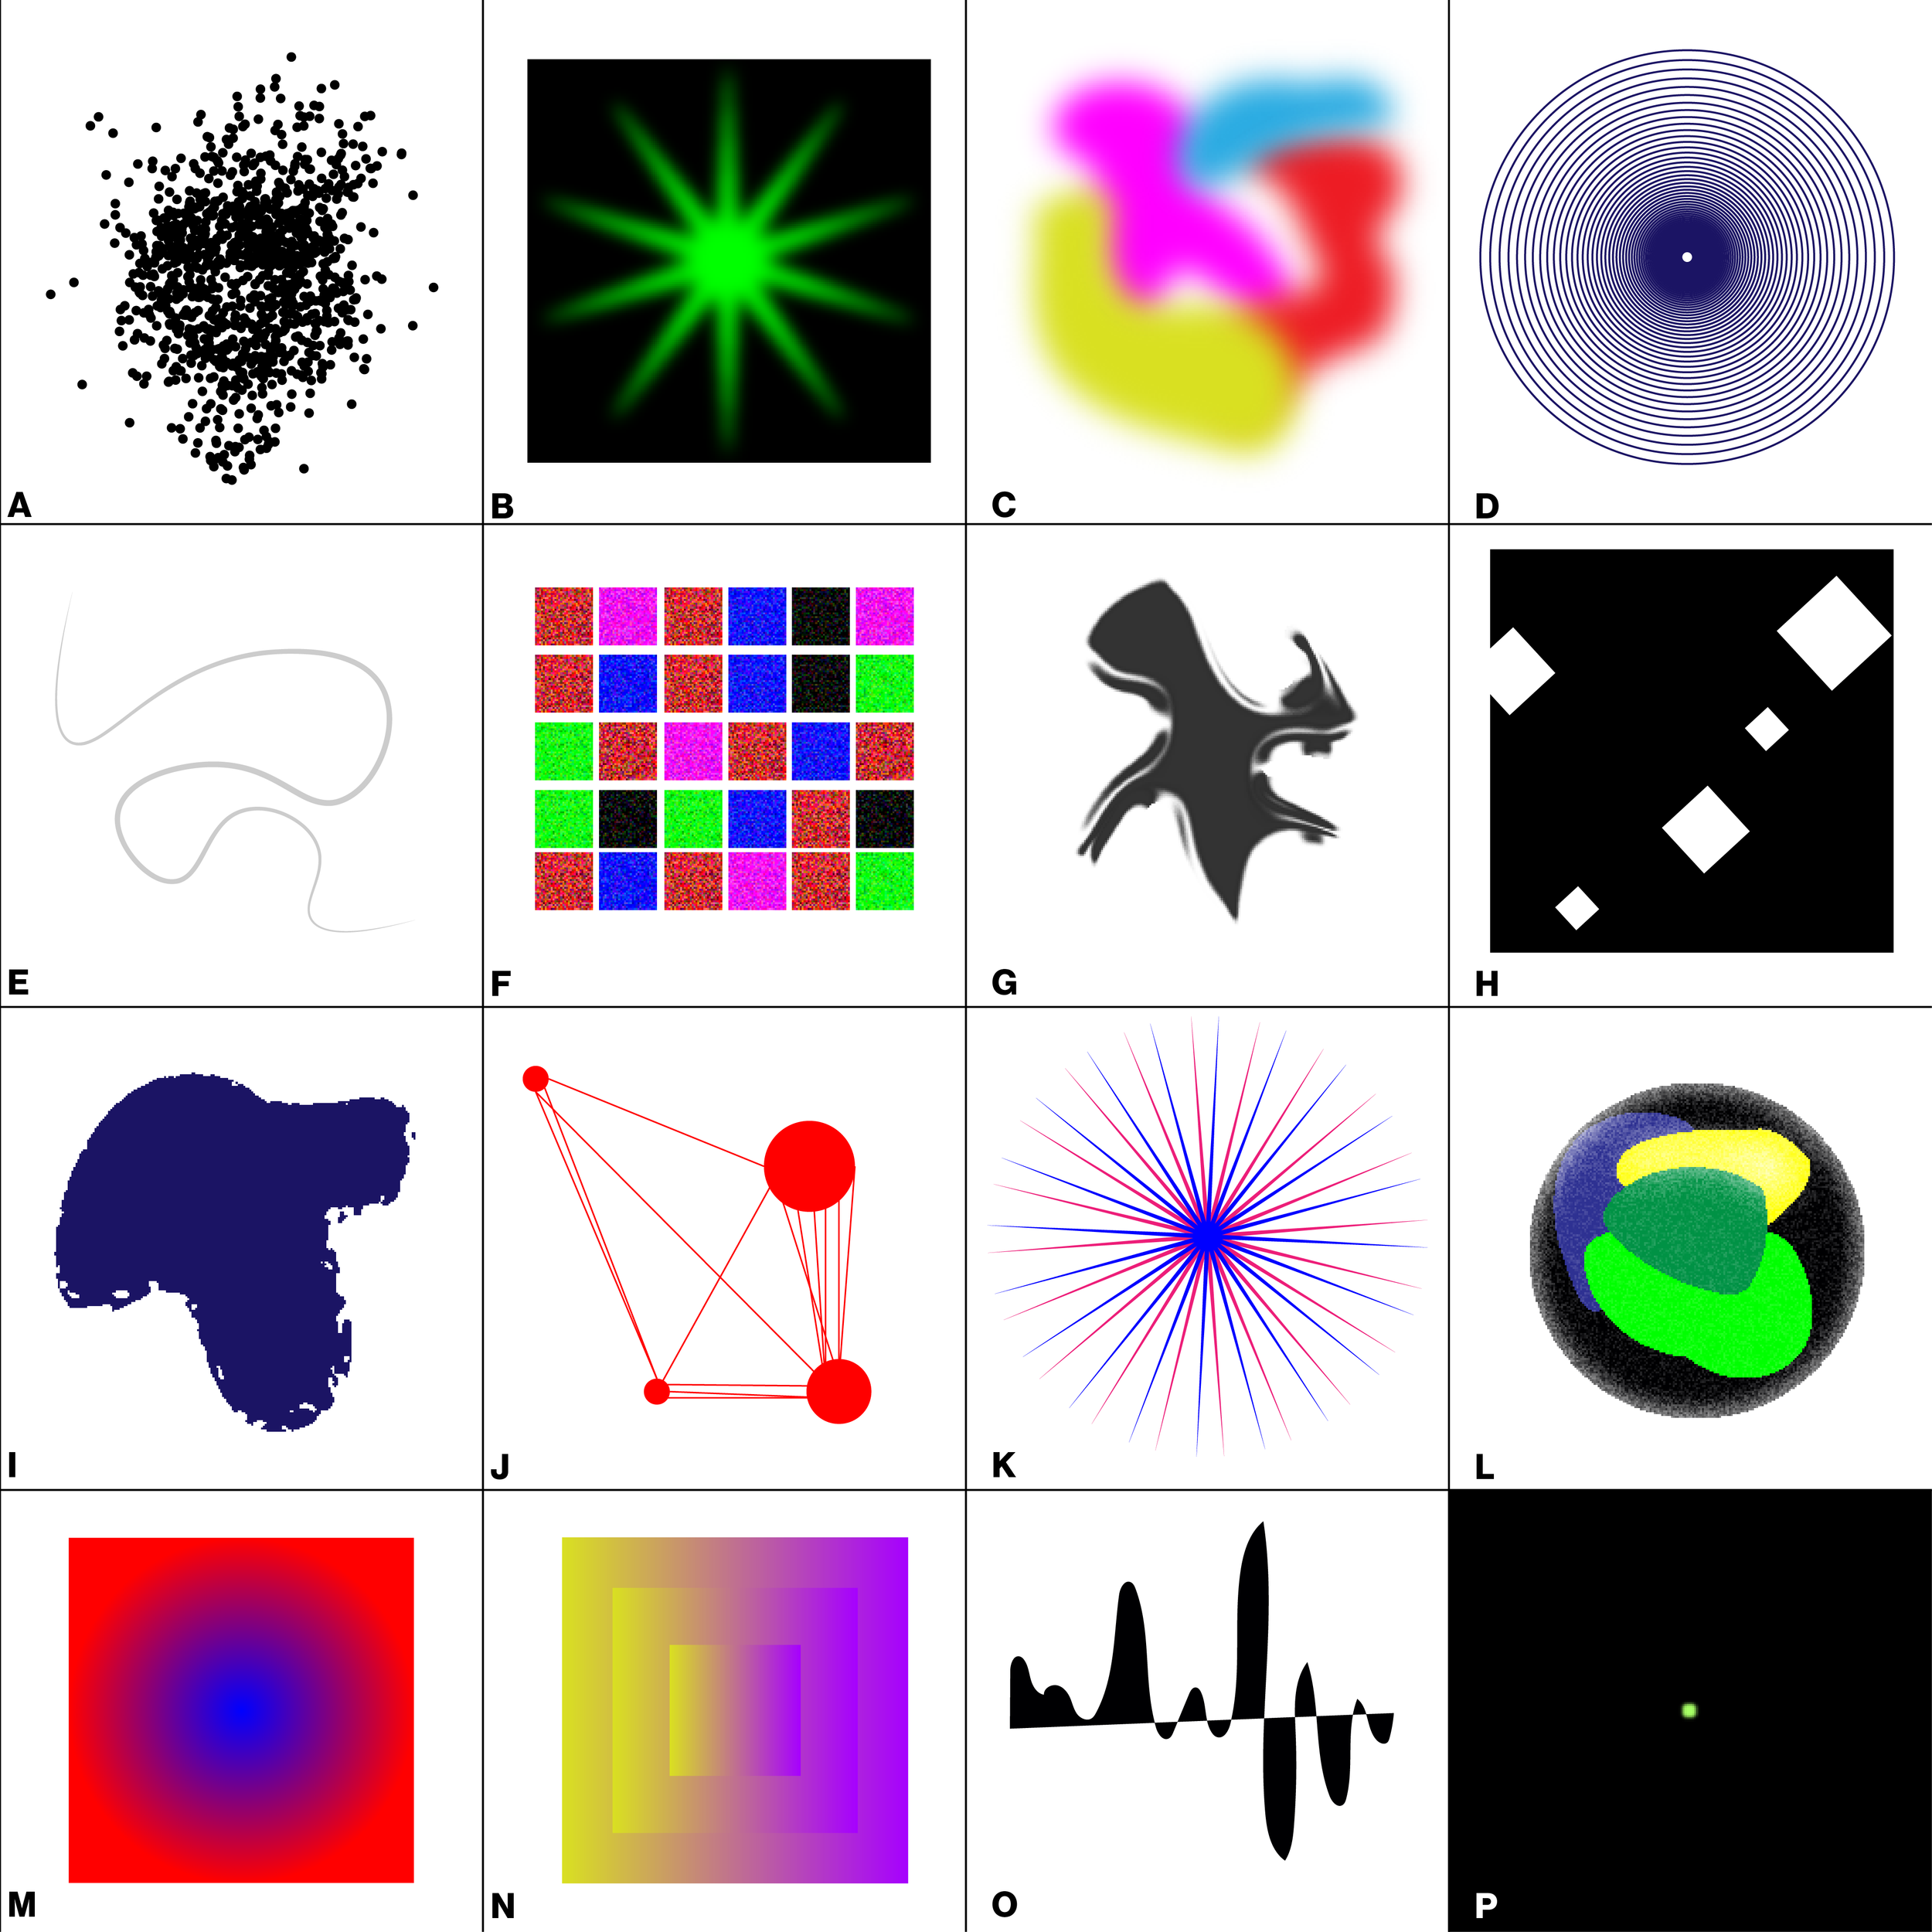
test visuals
Experimental Stage
* auto-documentation of moments of nostalgia: trigger, time and place when triggered, emotions, time and place of memory, memory contents (person, place, time, etc.); [resulting in several data visualizations]
* nostalgia activity: a 4-phase deck of cards meant to facilitate discussions about nostalgia; [understanding how people experience and express it differently]
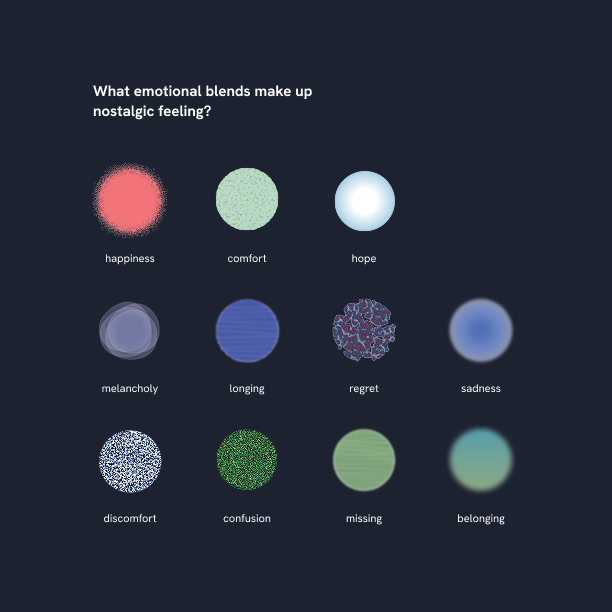
* online survey: asked 28 people about when/why people get nostalgic, what emotions they experience, also asked which visuals elicited strong emotions, asked to describe what the words “comfort”, “longing”, “melancholy”, and “fondness” look like; [seeing what visual forms can be used in affective visualizations and seeing if non-designers can think in visual ways]
* comfort and melancholy visuals: animated visuals based on survey descriptions of “comfort” and “melancholy” [asked participants how these videos made them feel]
* card sorting triggers: card sorting activity during which participants from each generational group organizes 42 triggers into “feels nostalgic” or “doesn’t feel nostalgic” groups and “feels personal” and “doesn’t feel personal” subgroups [understanding patterns across groups, resulted in an interactive trigger map]
Proposal Refinement
* focus on the Pacific Northwest due to unique identity and association with nostalgia in visual media
* emphasis on place-based nostalgia to drive the spatial component: development of 8 place types
* defining generational cohorts as Analog (1966-1978) and Digital (1990-2002)
* creation of 12-emotion framework
* development of survey and interview guide: considerations of group identity, weather as a memory enhancement, physical and temporal distance from past self/life/place, and more
* continued research of sensory mapping, affective cartography, and media landscapes
Online Survey (30 per cohort):
* rating emotional intensity
* describing nostalgic memory associated with a place type
* connections to identity, loss, and belonging
Follow-Up Interview (2-4 per cohort):
* in-depth discussion of memory
* sensory descriptions and visual exercises
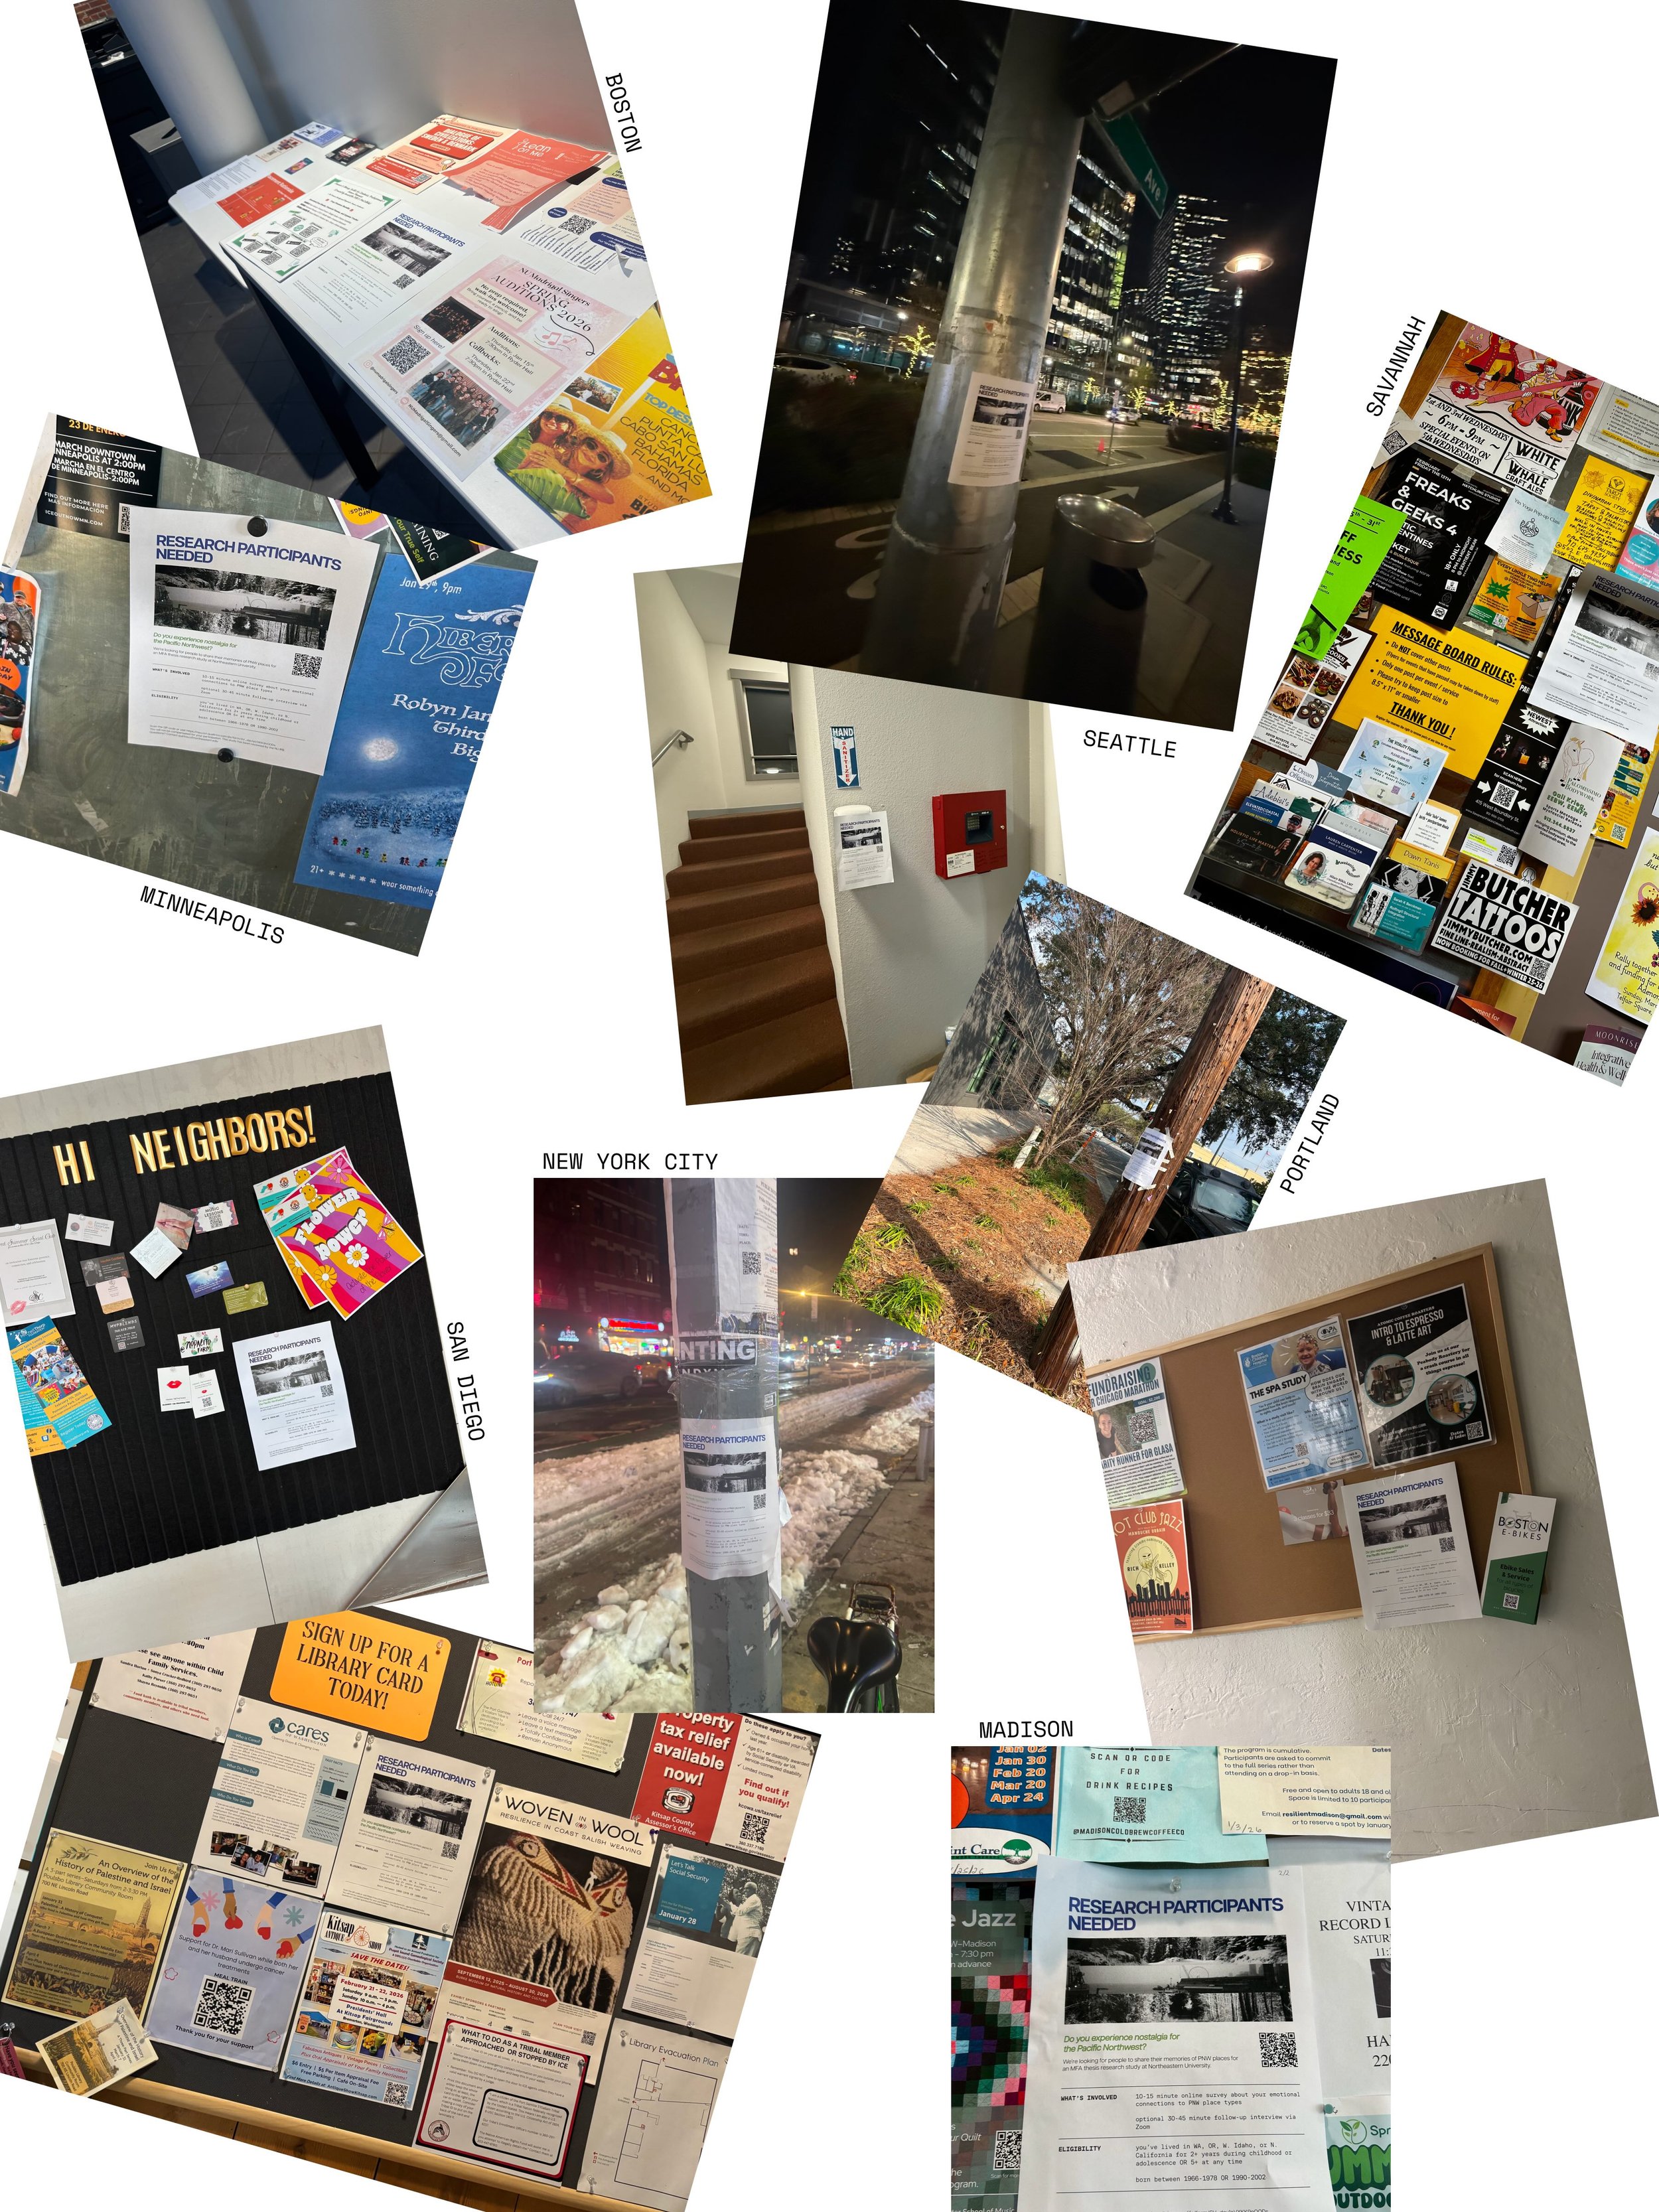
flyers posted on reddit and across the US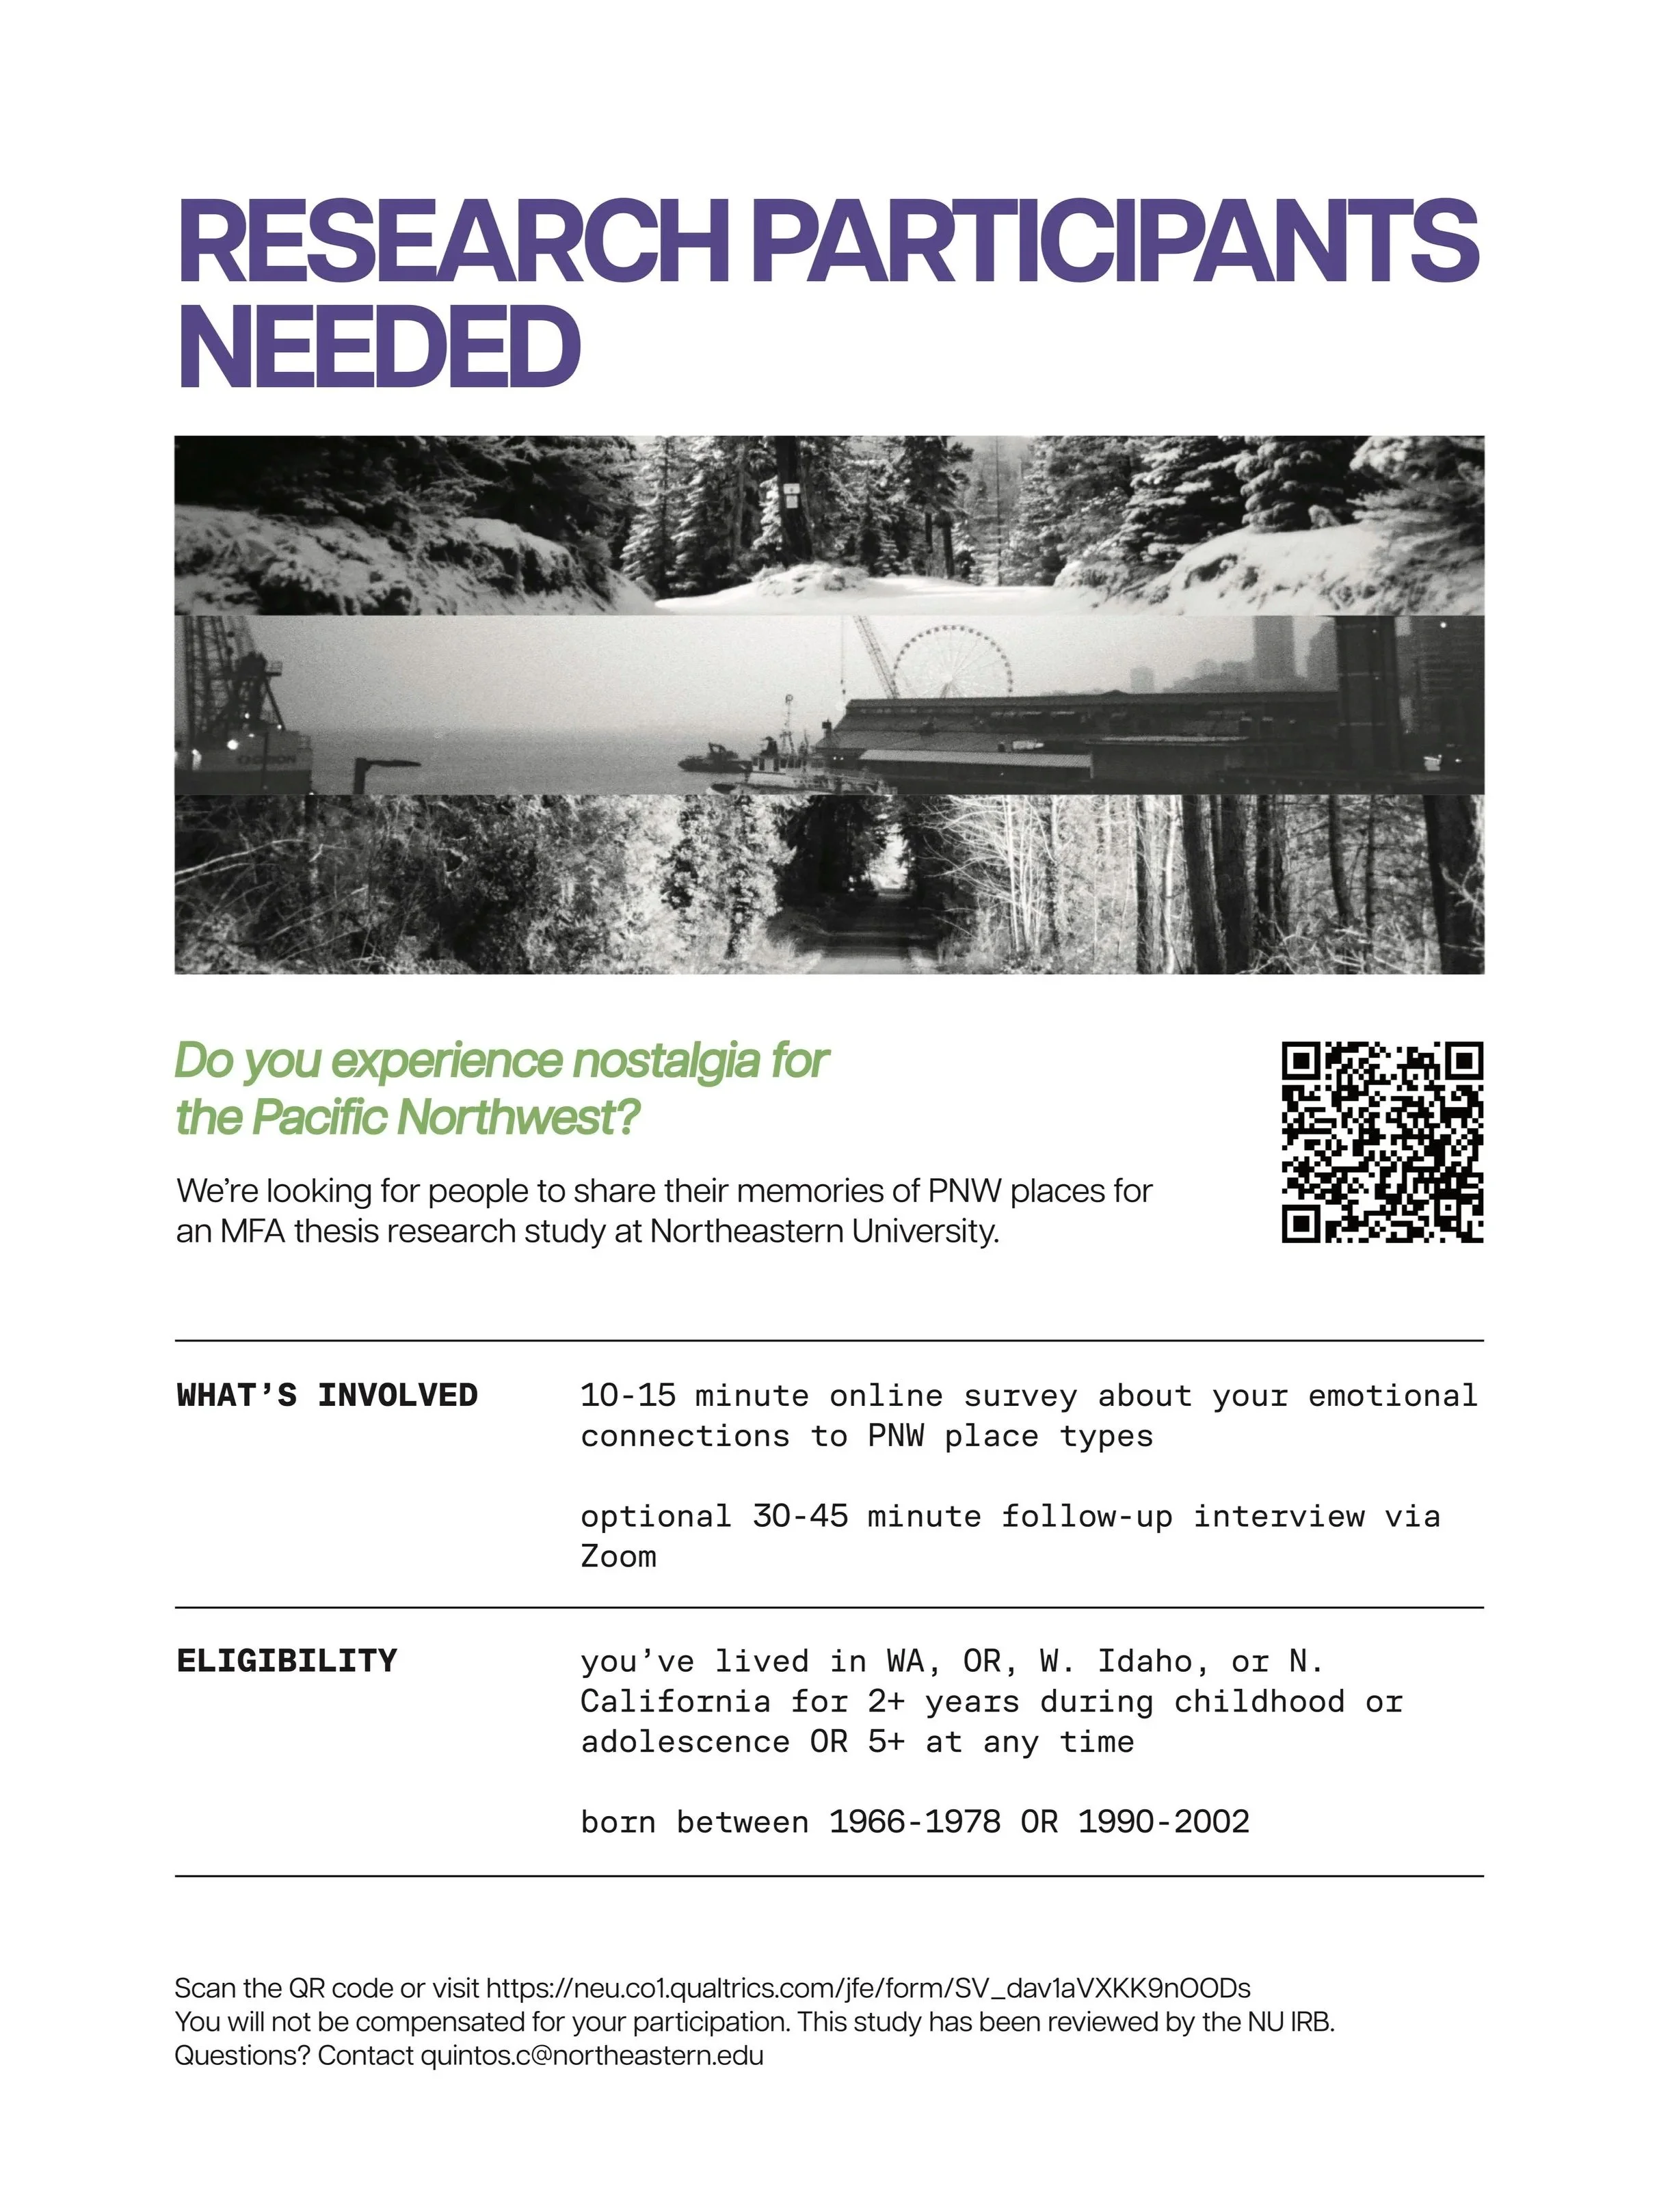
data analysis
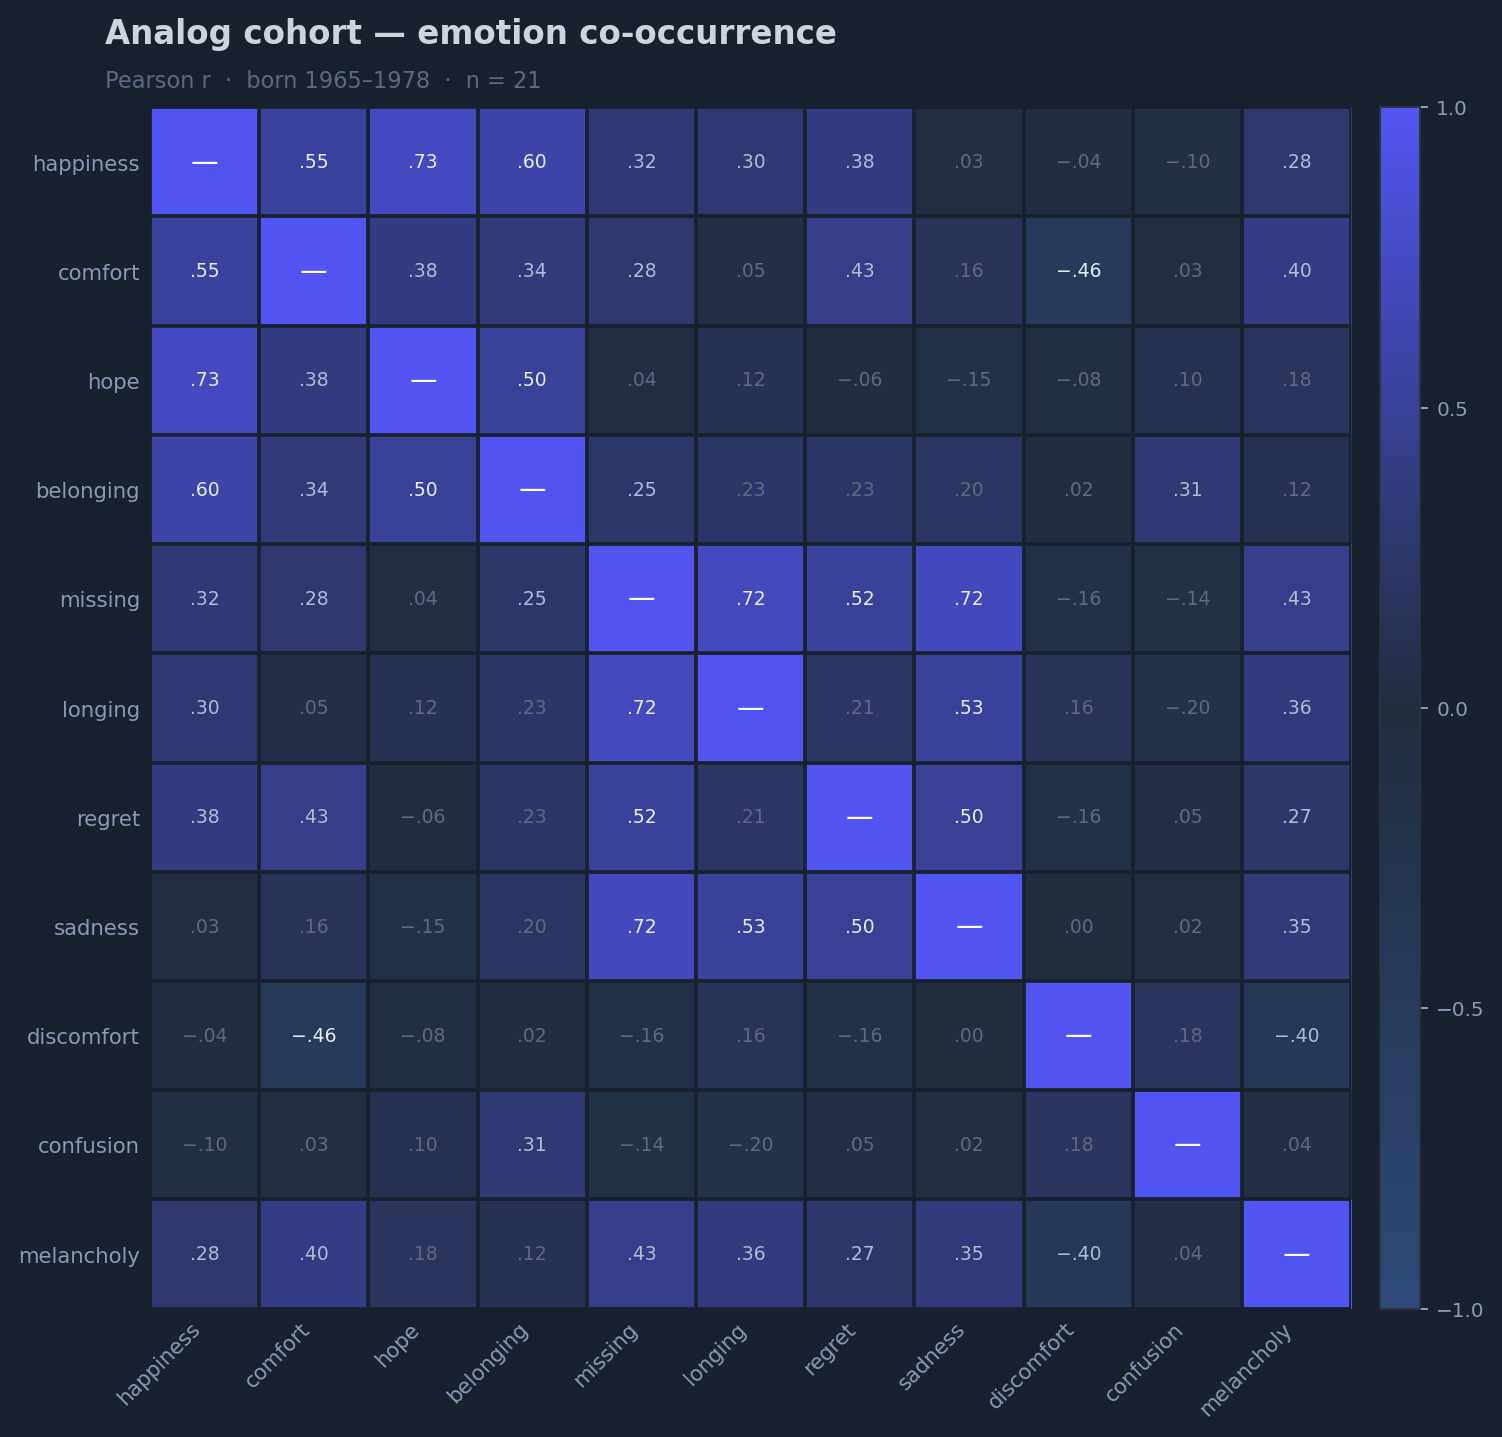
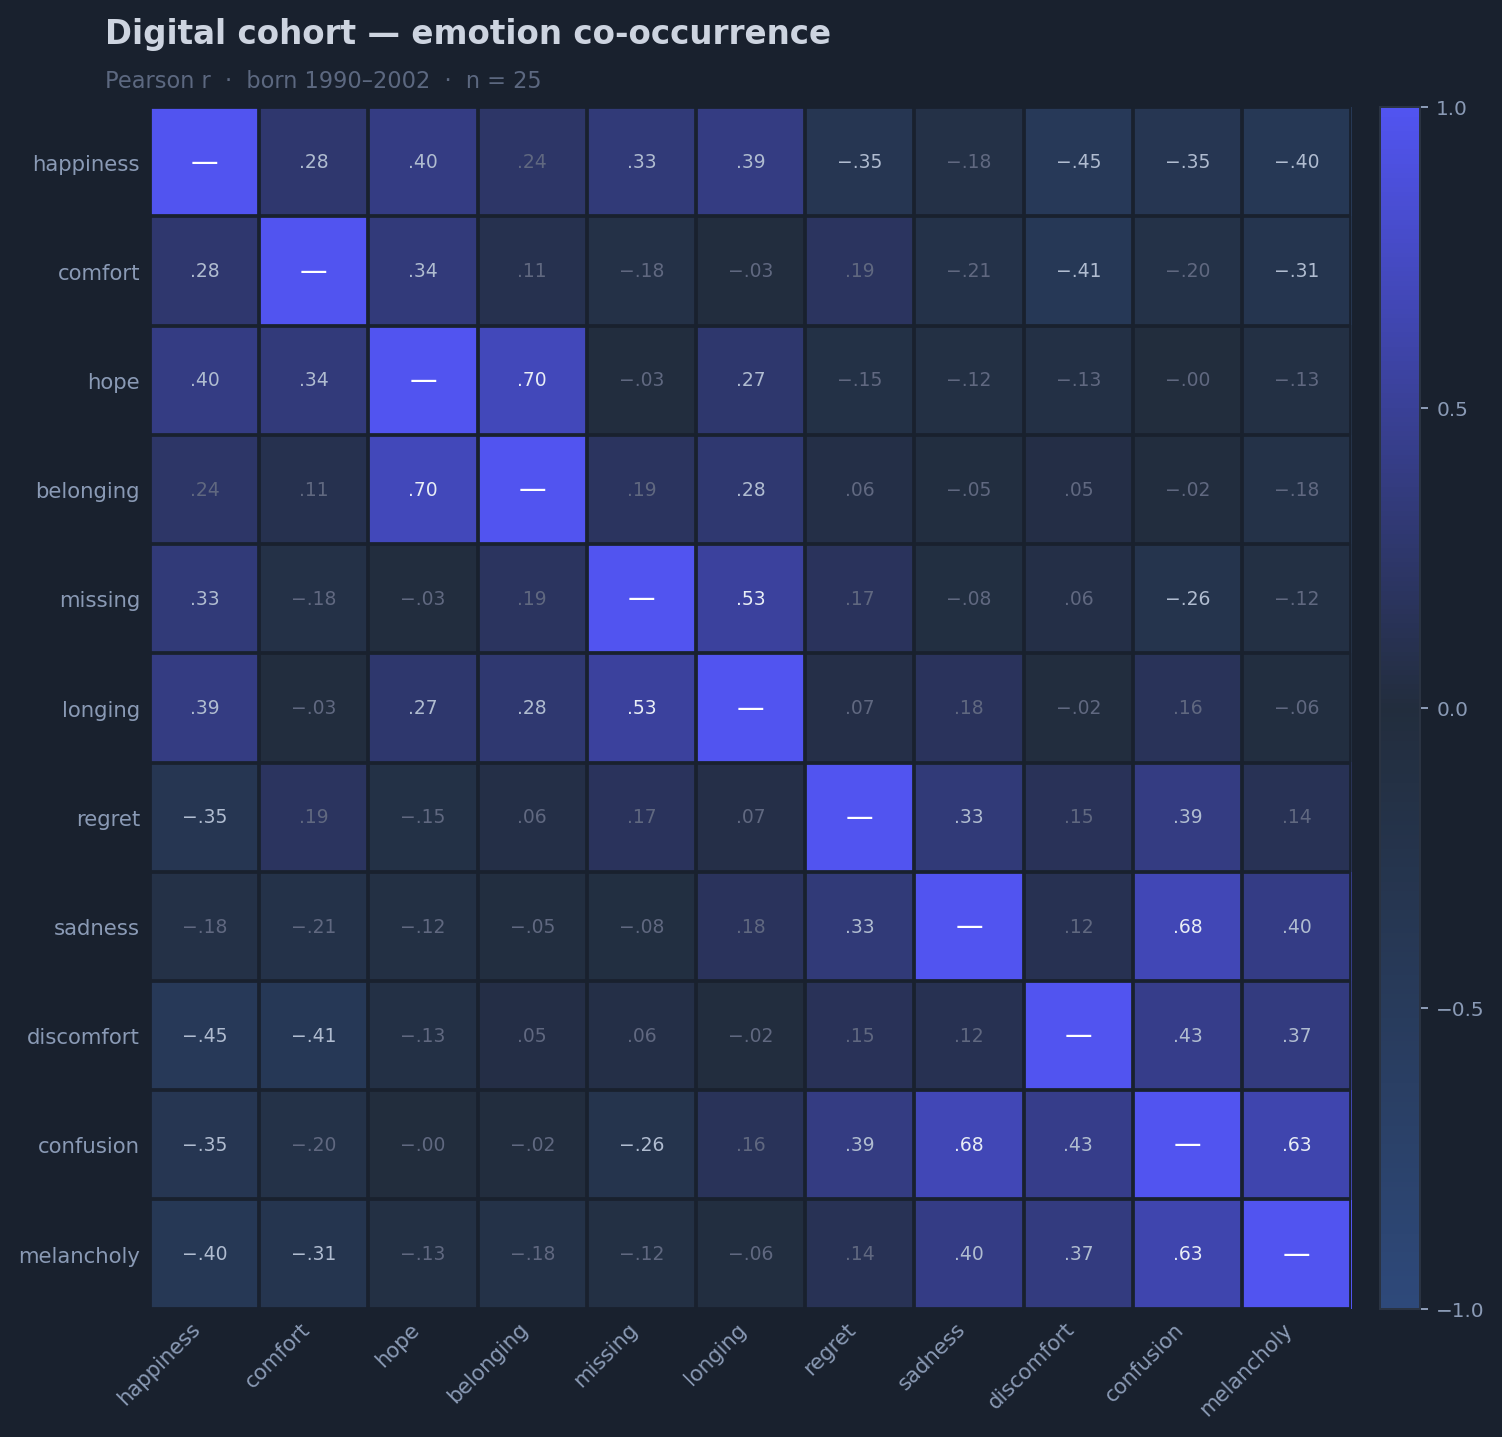
QUANTITATIVE: correlation tests (Cramer’s V, Pearson, and Mann-Whitney U)
QUALITATIVE: visual metaphor extraction, thematic mapping/coding
Happiness dominates (mean 8.28), but almost never appears alone — longing, comfort, and belonging cluster tightly with it
Nostalgia is empirically multi-emotional; happiness & longing is the defining pairing across both cohorts
Physical place is the dominant trigger (39/46), followed by weather, people, and smell — sensory richness runs throughout
67.4% of remembered places remain physically unchanged, reframing nostalgia as self-awareness rather than place-loss grief
Coastline dominates as place type (18/46); natural places correlate with happiness/hope/belonging, residential areas with comfort/missing
49% of memories are shared between specific others — nostalgia is relational, not purely private
Digital cohort carries significantly higher regret (p=.008) and longing (p=.014); warm emotions are equal, but the burden is heavier
Visual media is a notably higher trigger for Digital participants, pointing toward mediated, screen-based nostalgia
Design Stage
Began with creating color and texture palettes for individual emotions.
Revised colors to be more rooted in the PNW → muted, earthy.
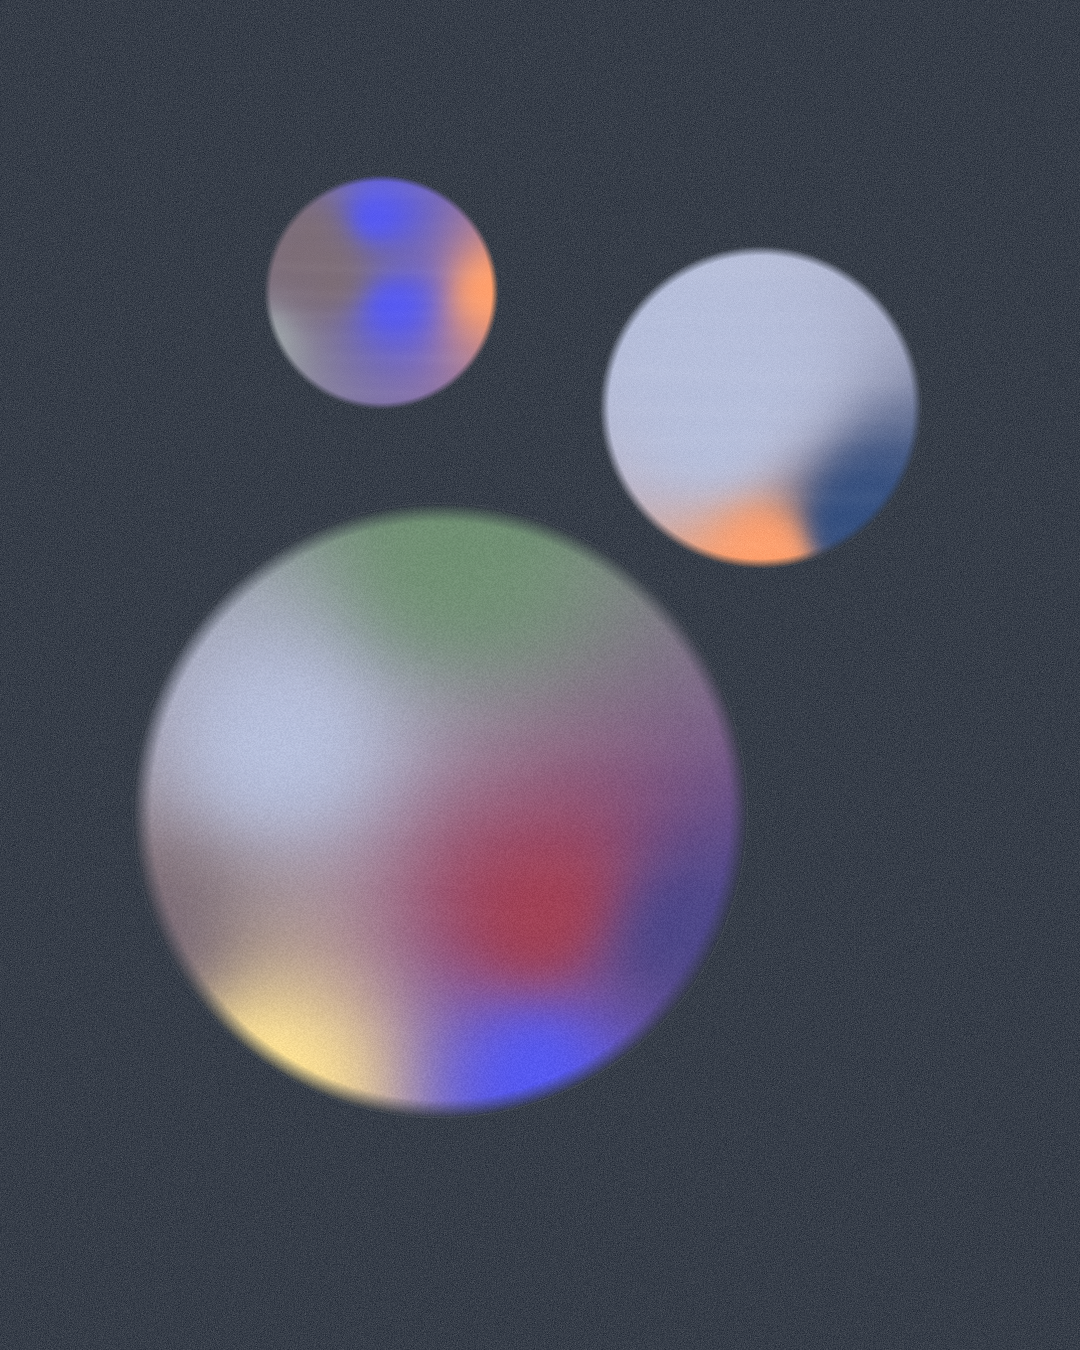
Testing shapes and visual properties to represent a memory; orbs, organic shapes, etc.
Figuring out how to efficiently build each memory without losing the nuance.
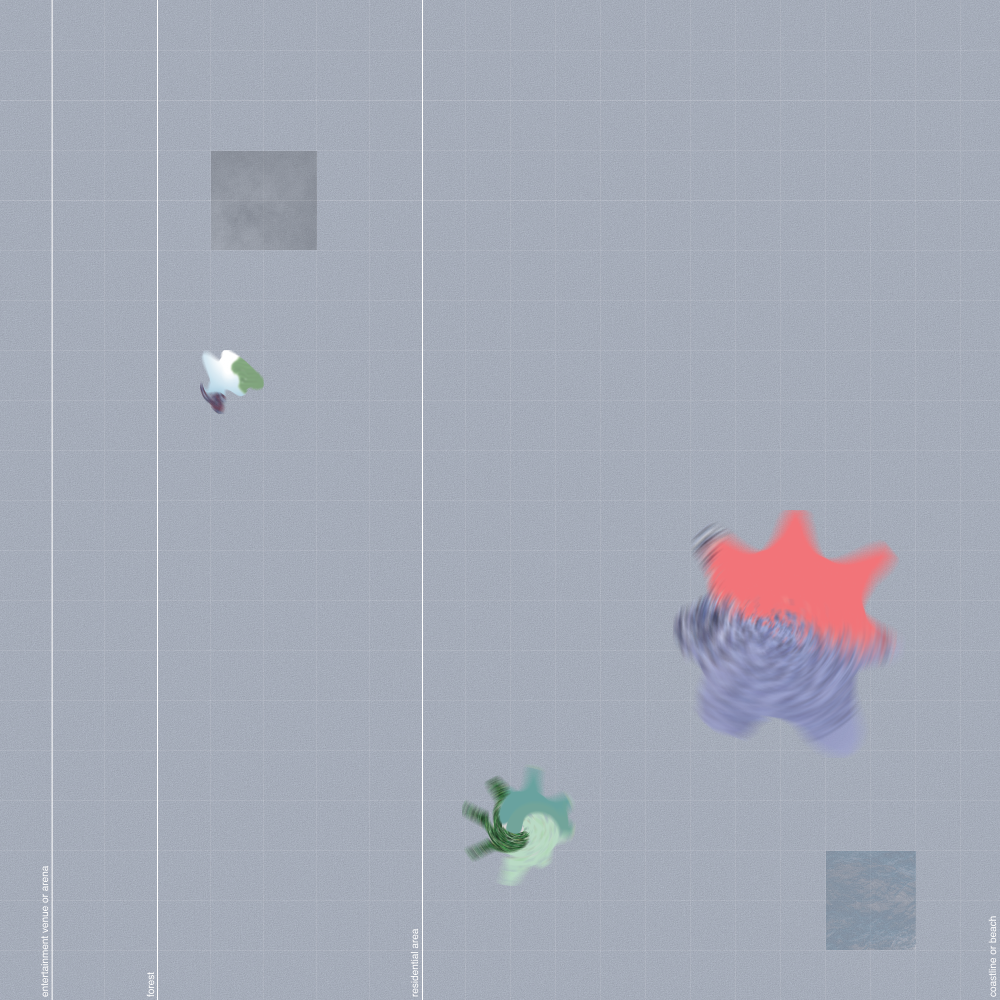
Attempting to represent place data through Voronoi diagram, found to be too rigid and unlike the soft nature of this project → blurry, diffused, rounded zones.
Thinking about how to represent connections and memory types (personal, shared, collective), implication of linkages → faint halos and lines.
Visual iteration directed by audience feedback.
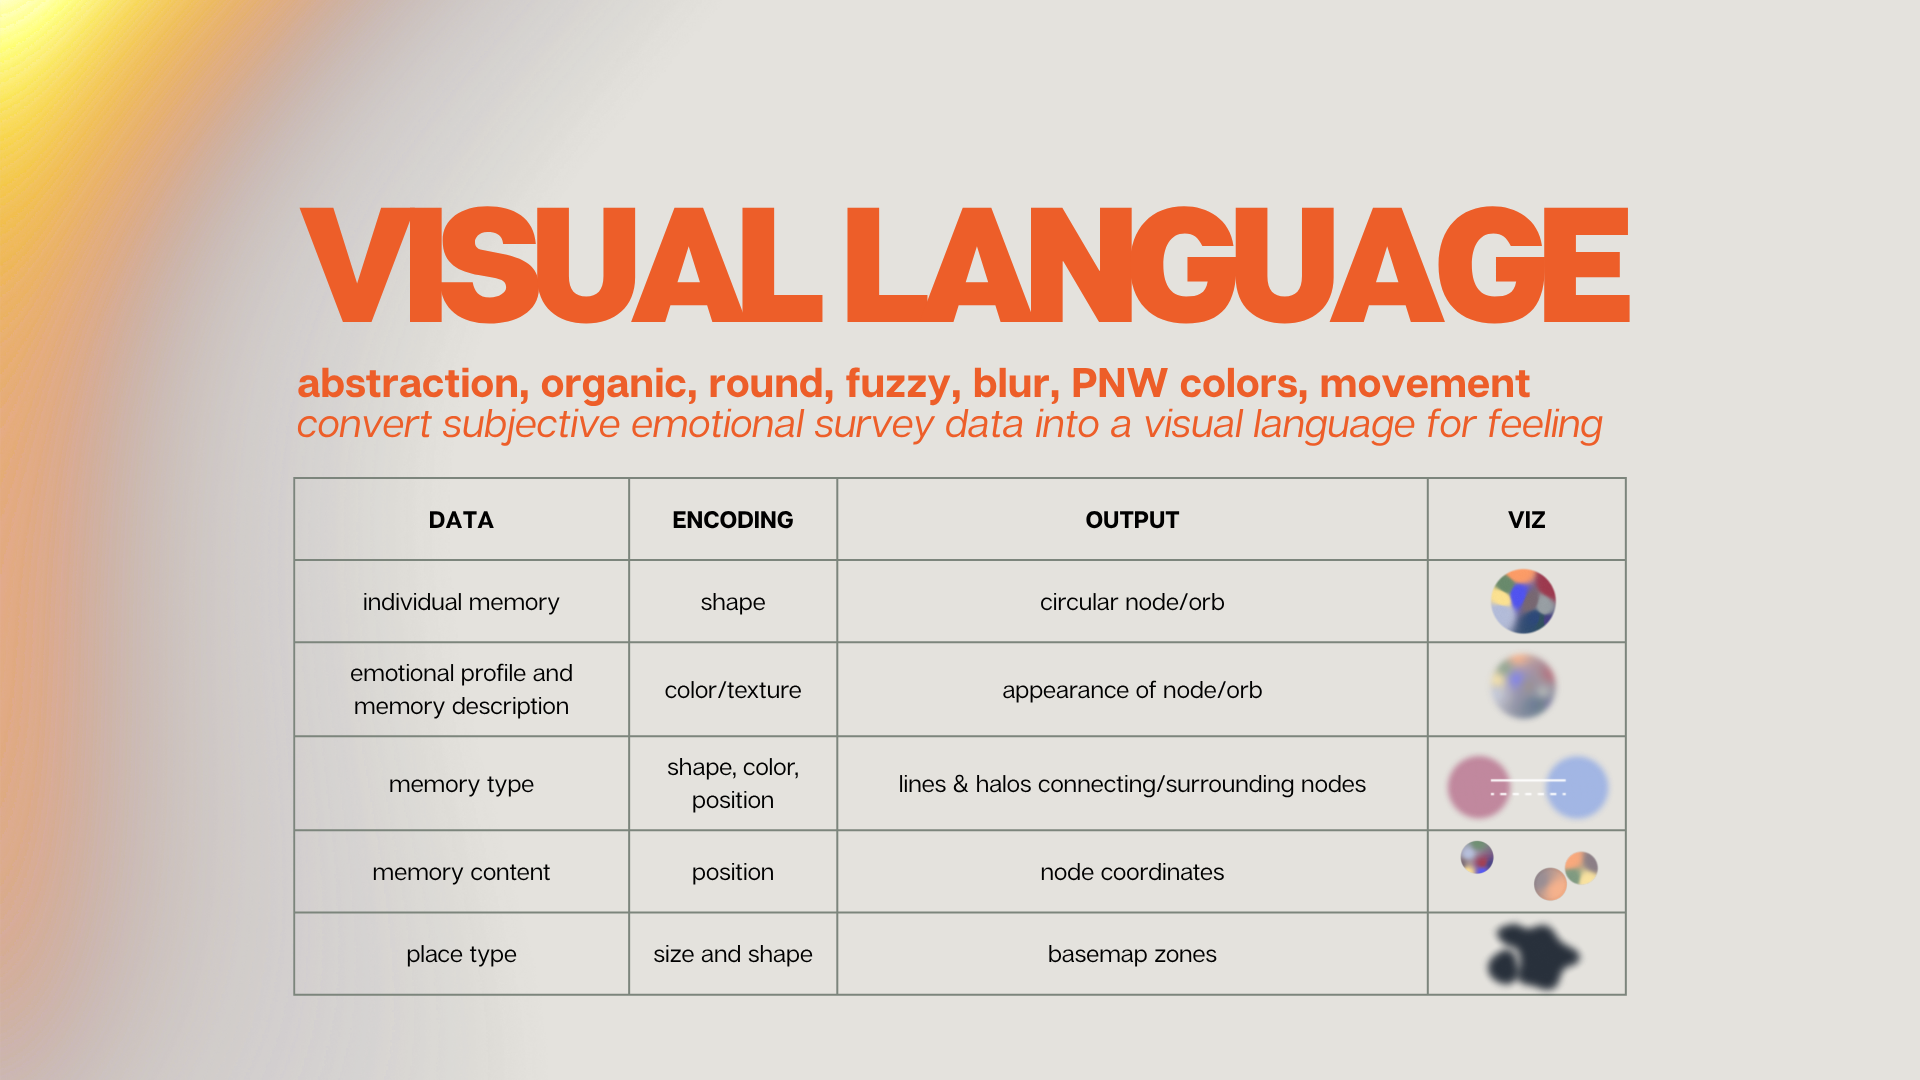
FINAL Overall Language
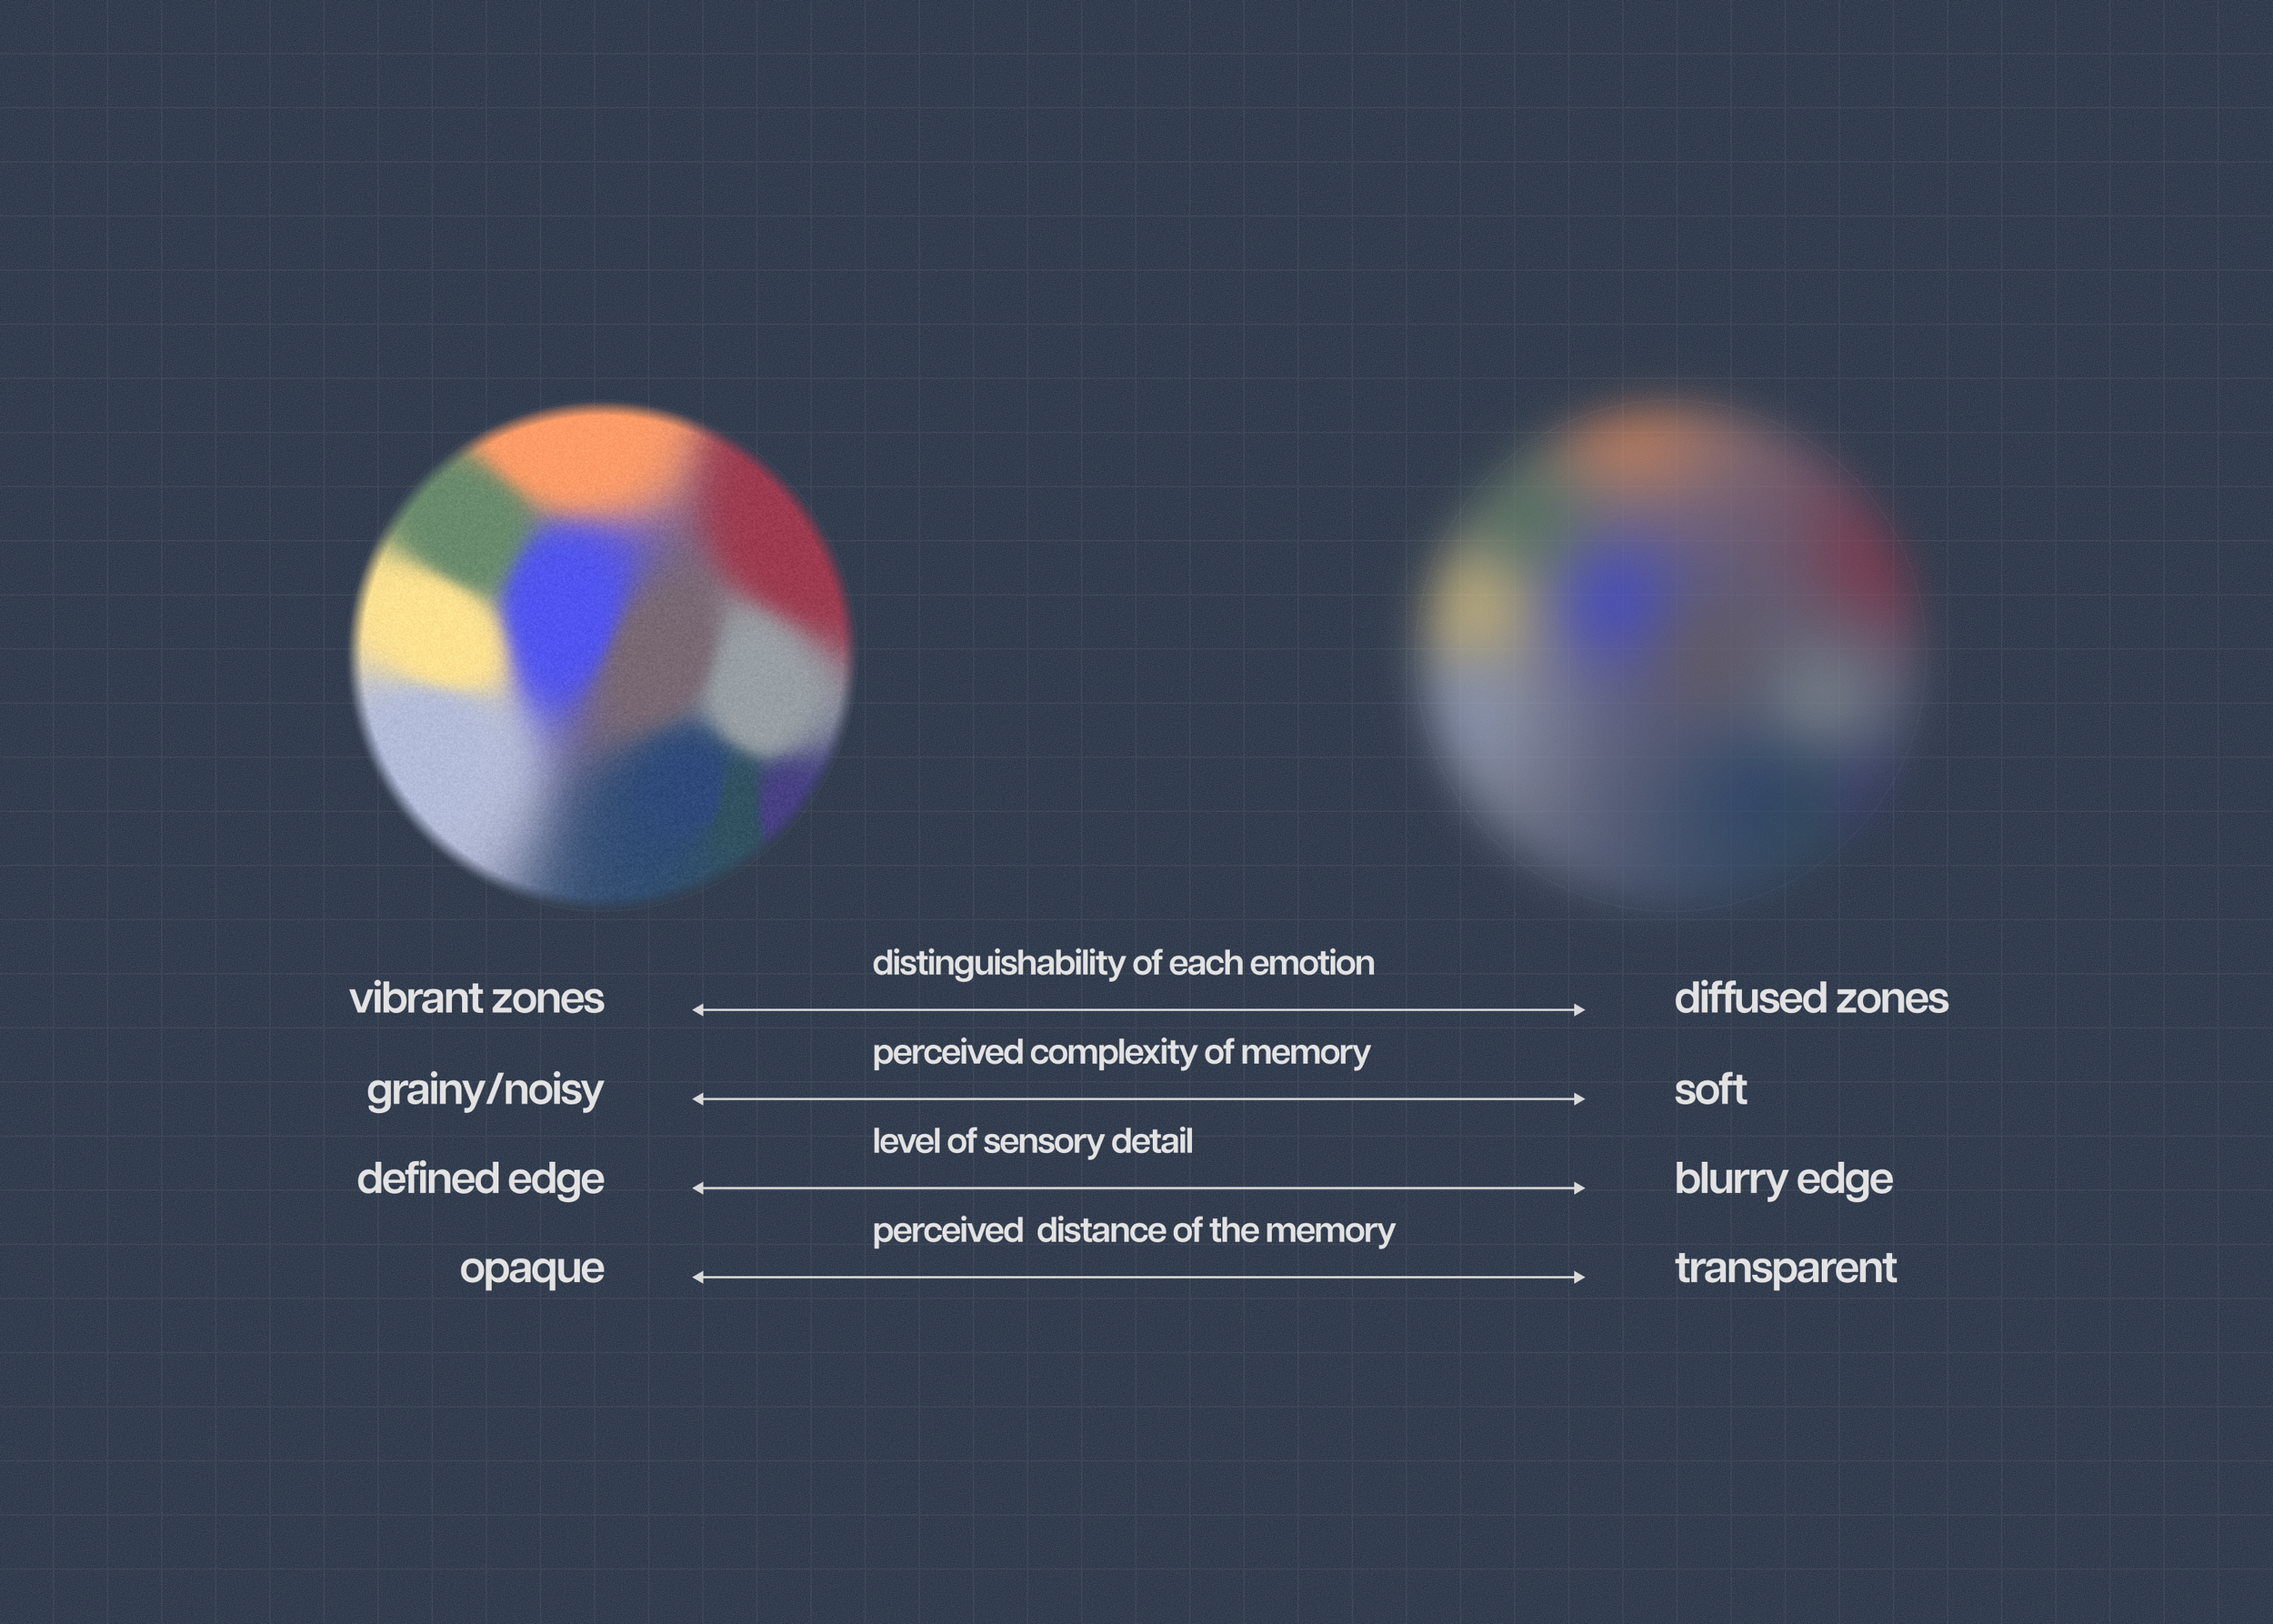
FINAL How to Read the Orb
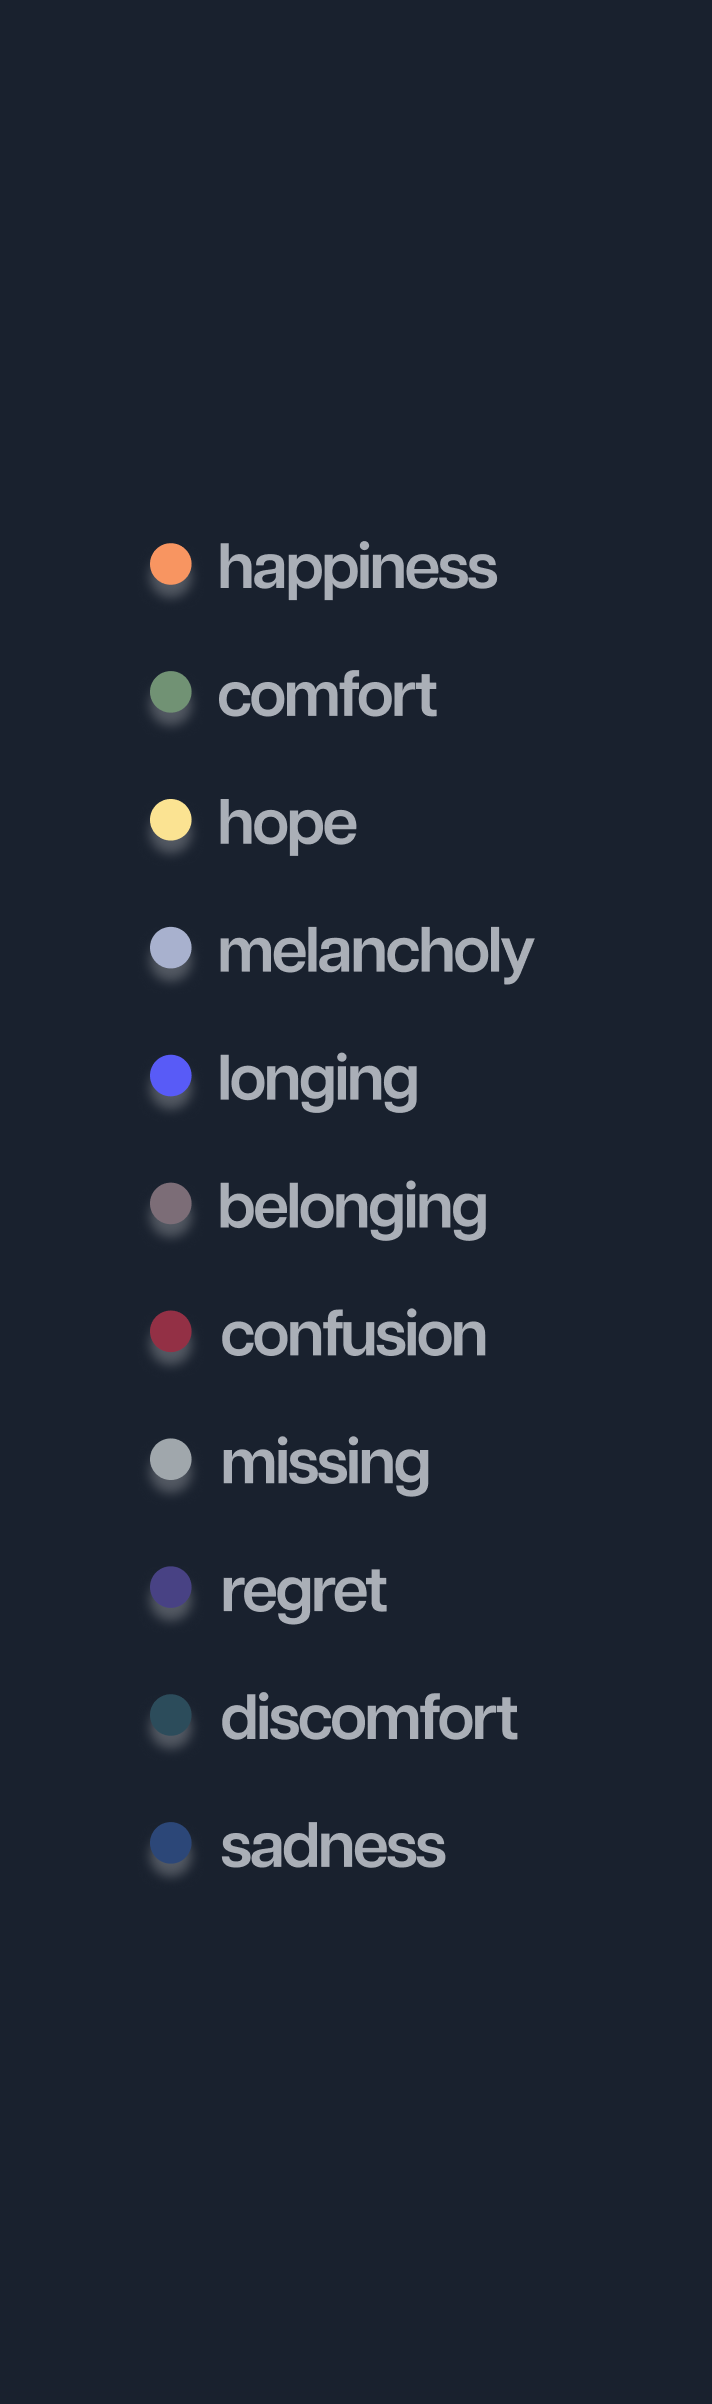
FINAL Emotion Colors
Static Digital Map V2
V3 Emotion Palette
Node Test
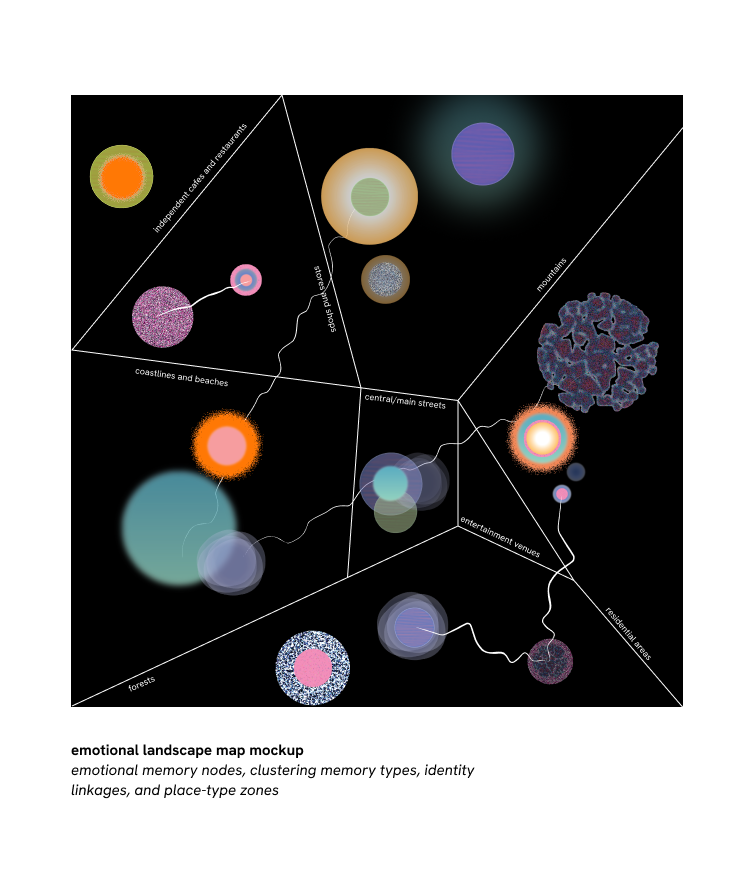
V1 Map Mockup
V2 Map Mockup
FINAL OUTPUT
01: Memory Node Builder
* tool to visualize a single memory
* adjust appearance based on memory information
* attach metadata, download, or add to database
02: Nostalgia Database
* add glowing memory nodes to a public space
* browse and filter to view all added memories
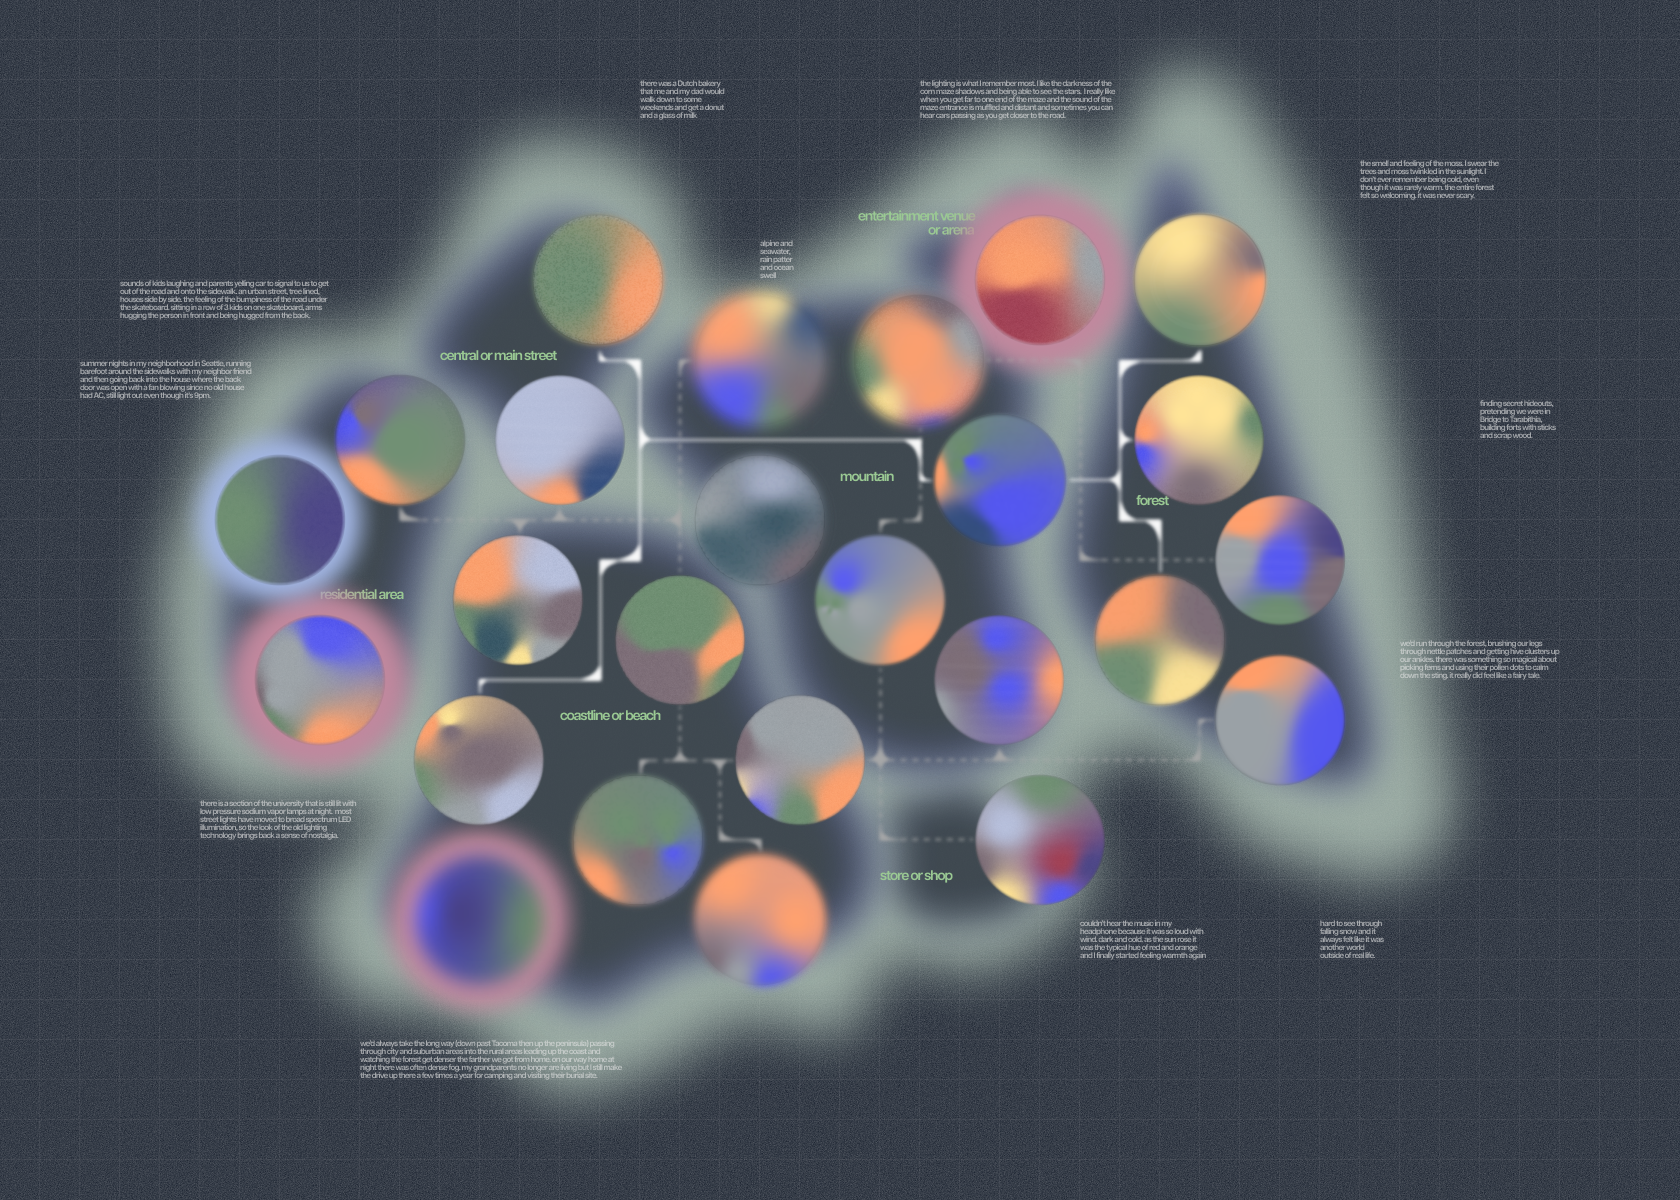
03: Pacific Northwest Maps
* memories from dataset plotted across place type zones
* view single cohort or split view
* filter, toggle, zoom, hover, click to see different layers of data
FIGMA, D3.JS, ADOBE ILLUSTRATOR, HTML CANVAS, VSCODE, ETC.